Promtheus 架构
Prometheus 是一个开源监控系统,它本身已经成为了云原生中指标监控的事实标准 。
k8s集群监控体系演变史
第一版本:Cadvisor+InfluxDB+Grafana
只能从主机维度进行采集,没有Namespace、Pod等维度的汇聚功能
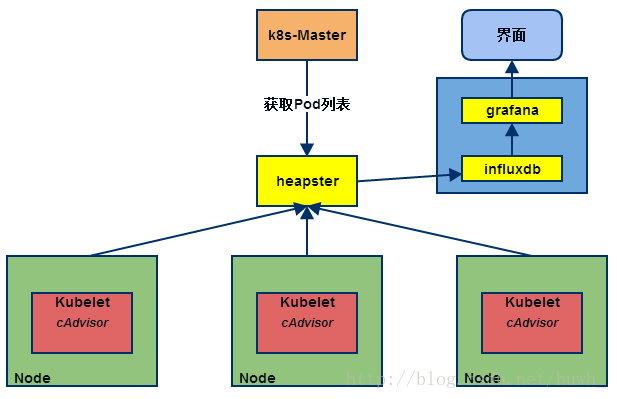
第二版本: Heapster+InfluxDB+Grafana
heapster负责调用各node中的cadvisor接口,对数据进行汇总,然后导到InfluxDB , 可以从cluster,node,pod的各个层面提供详细的资源使用情况。
第三版本:Metrics-Server + Prometheus
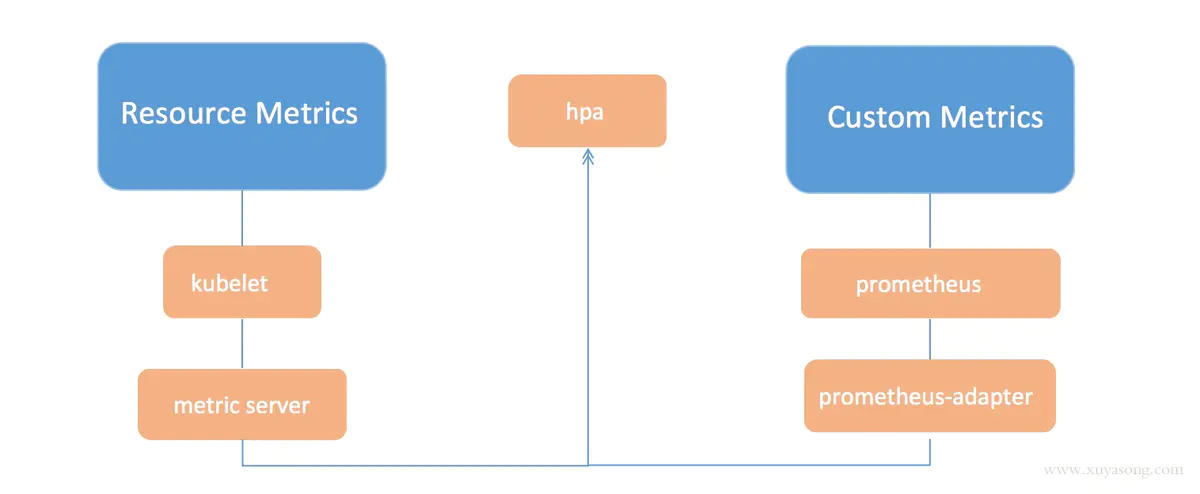
k8s对监控接口进行了标准化,主要分了三类:
- Resource Metrics
metric-api对应的接口是 metrics.k8s.io,主要的实现就是 metrics-server,它提供的是资源的监控,比较常见的是节点级别、pod 级别、namespace 级别、class 级别。这类的监控指标都可以通过 metrics.k8s.io 这个接口获取到
- Custom Metrics
对应的接口是 custom.metrics.k8s.io,主要的实现是 Prometheus, 它提供的是资源监控和自定义监控,资源监控和上面的资源监控其实是有覆盖关系的。
自定义监控指的是:比如应用上面想暴露一个类似像在线人数,或者说调用后面的这个数据库的 MySQL 的慢查询。这些其实都是可以在应用层做自己的定义的,然后并通过标准的 Prometheus 的 client,暴露出相应的 metrics,然后再被 Prometheus 进行采集
- External Metrics
对应的接口是 external.metrics.k8s.io。主要的实现厂商就是各个云厂商的 provider,通过这个 provider 可以通过云资源的监控指标
Prometheus架构
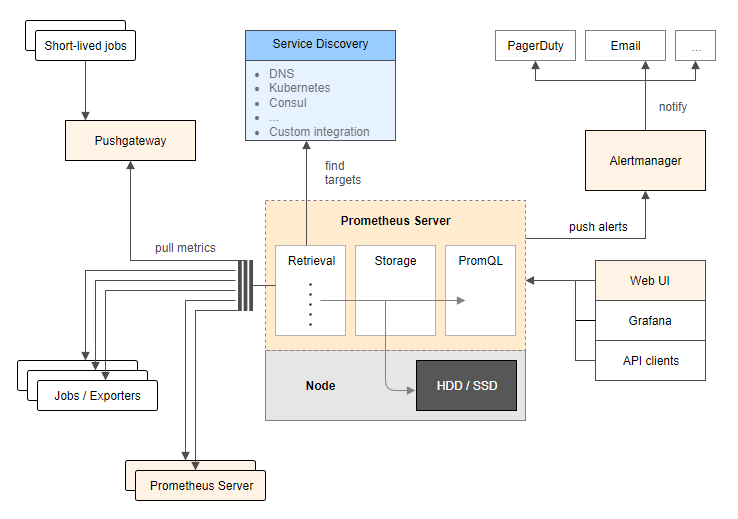
- Prometheus Server ,监控、告警平台核心,抓取目标端监控数据,生成聚合数据,存储时间序列数据
- exporter,由被监控的对象提供,提供API暴漏监控对象的指标,供prometheus 抓取
- node-exporter
- blackbox-exporter
- redis-exporter
- mysql-exporter
- custom-exporter
- ...
- pushgateway,提供一个网关地址,外部数据可以推送到该网关,prometheus也会从该网关拉取数据
- Alertmanager,接收Prometheus发送的告警并对于告警进行一系列的处理后发送给指定的目标
- Grafana:配置数据源,图标方式展示数据
安装
Prometheus安装
基于go开发, https://github.com/prometheus/prometheus
若使用docker部署直接启动镜像即可:
我们想制作Prometheus的yaml文件,可以先启动容器进去看一下默认的启动命令:
$ docker run -d --name tmp -p 9090:9090 prom/prometheus:v2.28.0
$ docker exec -ti tmp sh
#/ ps aux
#/ cat /etc/prometheus/prometheus.yml
# my global config
global:
  scrape_interval:     15s # Set the scrape interval to every 15 seconds. Default is every 1 minute.
  evaluation_interval: 15s # Evaluate rules every 15 seconds. The default is every 1 minute.
  # scrape_timeout is set to the global default (10s).

# Alertmanager configuration
alerting:
  alertmanagers:
  - static_configs:
    - targets:
      # - alertmanager:9093

# Load rules once and periodically evaluate them according to the global 'evaluation_interval'.
rule_files:
  # - "first_rules.yml"
  # - "second_rules.yml"

# A scrape configuration containing exactly one endpoint to scrape:
# Here it's Prometheus itself.
scrape_configs:
  # The job name is added as a label `job=<job_name>` to any timeseries scraped from this config.
  - job_name: 'prometheus'

    # metrics_path defaults to '/metrics'
    # scheme defaults to 'http'.

    static_configs:
    - targets: ['localhost:9090']

$ exit
$ docker rm -f tmp
本例中,使用k8s来部署,所需的资源清单如下:
mkdir -p monitor/prometheus/ ; cd monitor/prometheus/

# 需要准备配置文件,因此使用configmap的形式保存
cat <<\EOF > prometheus.yml
# my global config
global:
  scrape_interval: 30s
  evaluation_interval: 30s
  # scrape_timeout is set to the global default (10s).

# Alertmanager configuration
alerting:
  alertmanagers:
  - static_configs:
    - targets:
      # - alertmanager:9093

# Load rules once and periodically evaluate them according to the global 'evaluation_interval'.
rule_files:
  # - "first_rules.yml"
  # - "second_rules.yml"

# A scrape configuration containing exactly one endpoint to scrape:
# Here it's Prometheus itself.
scrape_configs:
  - job_name: 'prometheus'
    static_configs:
    - targets: ['localhost:9090']
EOF

# kubectl -n monitor delete configmap prometheus-config
# kubectl -n monitor create configmap prometheus-config --from-file=prometheus.yml

# pvc
cat <<\EOF > pvc.yaml
kind: PersistentVolumeClaim
apiVersion: v1
metadata:
  name: prometheus
  namespace: monitor
spec:
  accessModes:
    - ReadWriteOnce
  storageClassName: nfs
  resources:
    requests:
      storage: 200Gi
EOF

# prometheus的资源文件
# 出现Prometheus数据存储权限问题,因为Prometheus内部使用nobody启动进程,挂载数据目录后权限为root,因此使用initContainer进行目录权限修复:
cat <<\EOF > prometheus-deployment.yaml
apiVersion: apps/v1
kind: Deployment
metadata:
  name: prometheus
  namespace: monitor
  labels:
    app: prometheus
spec:
  selector:
    matchLabels:
      app: prometheus
  template:
    metadata:
      labels:
        app: prometheus
    spec:
      serviceAccountName: prometheus
      initContainers:
      - name: "change-permission-of-directory"
        image: busybox
        command: ["/bin/sh"]
        args: ["-c", "chown -R 65534:65534 /prometheus"]
        securityContext:
          privileged: true
        volumeMounts:
        - mountPath: "/etc/prometheus"
          name: config-volume
        - mountPath: "/prometheus"
          name: data
      containers:
      - image: prom/prometheus:v2.28.0
        name: prometheus
        args:
        - "--config.file=/etc/prometheus/prometheus.yml"
        - "--storage.tsdb.path=/prometheus"  # 指定tsdb数据路径
        - "--web.enable-lifecycle"  # 支持热更新,直接执行localhost:9090/-/reload立即生效
        - "--web.console.libraries=/usr/share/prometheus/console_libraries"
        - "--web.console.templates=/usr/share/prometheus/consoles"
        ports:
        - containerPort: 9090
          name: http
        volumeMounts:
        - mountPath: "/etc/prometheus"
          name: config-volume
        - mountPath: "/prometheus"
          name: data
        resources:
          requests:
            cpu: 100m
            memory: 512Mi
          limits:
            cpu: 100m
            memory: 512Mi
      volumes:
      - name: data
        persistentVolumeClaim:
          claimName: prometheus
      - configMap:
          name: prometheus-config
        name: config-volume
EOF

# rbac,prometheus会调用k8s api做服务发现进行抓取指标
cat <<\EOF > prometheus-rbac.yaml
apiVersion: v1
kind: ServiceAccount
metadata:
  name: prometheus
  namespace: monitor
---
apiVersion: rbac.authorization.k8s.io/v1
kind: ClusterRole
metadata:
  name: prometheus
rules:
- apiGroups:
  - ""
  resources:
  - nodes
  - services
  - endpoints
  - pods
  - nodes/proxy
  verbs:
  - get
  - list
  - watch
- apiGroups:
  - "extensions"
  resources:
    - ingresses
  verbs:
  - get
  - list
  - watch
- apiGroups:
  - ""
  resources:
  - configmaps
  - nodes/metrics
  verbs:
  - get
- nonResourceURLs:
  - /metrics
  verbs:
  - get
---
apiVersion: rbac.authorization.k8s.io/v1
kind: ClusterRoleBinding
metadata:
  name: prometheus
roleRef:
  apiGroup: rbac.authorization.k8s.io
  kind: ClusterRole
  name: prometheus
subjects:
- kind: ServiceAccount
  name: prometheus
  namespace: monitor
EOF

# 提供Service,为Ingress使用
cat <<\EOF > prometheus-svc.yaml
apiVersion: v1
kind: Service
metadata:
  name: prometheus
  namespace: monitor
  labels:
    app: prometheus
spec:
  selector:
    app: prometheus
  type: ClusterIP
  ports:
    - name: web
      port: 9090
      targetPort: http
EOF

cat <<\EOF > prometheus-ingress.yaml
apiVersion: networking.k8s.io/v1
kind: Ingress
metadata:
  name: prometheus
  namespace: monitor
spec:
  ingressClassName: nginx
  rules:
  - host: prometheus.luffy.com
    http:
      paths:
      - path: /
        pathType: Prefix
        backend:
          service:
            name: prometheus
            port:
              number: 9090
EOF
部署上述资源:
# 命名空间
kubectl create namespace monitor

# 配置文件
kubectl -n monitor create configmap prometheus-config --from-file=prometheus.yml

#部署configmap
# kubectl apply -f .
kubectl create -f pvc.yaml
kubectl create -f prometheus-deployment.yaml
kubectl create -f prometheus-rbac.yaml
kubectl create -f prometheus-svc.yaml
kubectl create -f prometheus-ingress.yaml

kubectl delete -f pvc.yaml
kubectl -n monitor delete configmap prometheus-config
kubectl delete -f prometheus-deployment.yaml
kubectl delete -f prometheus-rbac.yaml
kubectl delete -f prometheus-svc.yaml
kubectl delete -f prometheus-ingress.yaml


# 访问测试
kubectl -n monitor get ingress

# hosts修改
10.0.0.226 prometheus.luffy.com
# 浏览器访问

# kubectl -n monitor get ingress
NAME         CLASS   HOSTS                  ADDRESS   PORTS   AGE
prometheus   nginx   prometheus.luffy.com             80      13s
# kubectl -n monitor get deploy
NAME         READY   UP-TO-DATE   AVAILABLE   AGE
prometheus   1/1     1            1           2m29s
# kubectl -n monitor get pod -owide
NAME                         READY   STATUS    RESTARTS   AGE     IP            NODE         NOMINATED NODE   READINESS GATES
prometheus-6c8768547-7vh7p   1/1     Running   0       2m37s   10.244.2.63   k8s-slave2   <none>
# kubectl -n monitor logs -f prometheus-6c8768547-7vh7p
.... msg="Server is ready to receive web requests."

[root@k8s-master prometheus]# kubectl -n monitor get po -owide
NAME                         READY   STATUS    RESTARTS   AGE         IP            NODE         NOMINATED NODE   READINESS GATES
prometheus-6c8768547-7vh7p   1/1     Running   0          <invalid>   10.244.2.63   k8s-slave2   <none>           <none>
[root@k8s-master prometheus]# curl 10.244.2.63:9090/metrics
理解时间序列数据库(TSDB)
# http://localhost:9090/metrics
$ kubectl -n monitor get po -o wide
prometheus-6c8768547-7vh7p   1/1     Running   0          13h   10.244.2.63    k8s-slave1

$ curl http://10.244.2.63:9090/metrics
...
# HELP promhttp_metric_handler_requests_total Total number of scrapes by HTTP status code.
# TYPE promhttp_metric_handler_requests_total counter
promhttp_metric_handler_requests_total{code="200"} 5
promhttp_metric_handler_requests_total{code="500"} 0
promhttp_metric_handler_requests_total{code="503"} 0
tsdb(Time Series Database)
其中#号开头的两行分别为:
- HELP开头说明该行为指标的帮助信息,通常解释指标的含义
- TYPE开头是指明了指标的类型
- counter 计数器
- guage 测量器
- histogram 柱状图
- summary 采样点分位图统计
其中非#开头的每一行表示当前采集到的一个监控样本:
- promhttp_metric_handler_requests_total表明了当前指标的名称
- 大括号中的标签则反映了当前样本的一些特征和维度
- 浮点数则是该监控样本的具体值。
每次采集到的数据都会被Prometheus以time-series(时间序列)的方式保存到内存中,定期刷新到硬盘。如下所示,可以将time-series理解为一个以时间为X轴的数字矩阵:
  ^
  │   . . . . . . . . . . . . . . . . .   . .   node_cpu{cpu="cpu0",mode="idle"}
  │     . . . . . . . . . . . . . . . . . . .   node_cpu{cpu="cpu0",mode="system"}
  │     . . . . . . . . . .   . . . . . . . .   node_load1{}
  │     . . . . . . . . . . . . . . . .   . .
  v
    <------------------ 时间 ---------------->
在time-series中的每一个点称为一个样本(sample),样本由以下三部分组成:
- 指标(metric):metric name和描述当前样本特征的labelsets;
- 时间戳(timestamp):一个精确到毫秒的时间戳;
- 样本值(value): 一个float64的浮点型数据表示当前样本的值。
在形式上,所有的指标(Metric)都通过如下格式标示:
- 指标的名称(metric name)可以反映被监控样本的含义(比如,
http_request_total- 表示当前系统接收到的HTTP请求总量)。 - 标签(label)反映了当前样本的特征维度,通过这些维度Prometheus可以对样本数据进行过滤,聚合等。
Prometheus:定期去Tragets列表拉取监控数据,存储到TSDB中,并且提供指标查询、分析的语句和接口。
添加监控目标
coredns
添加监控目标
无论是业务应用还是k8s系统组件,只要提供了metrics api,并且该api返回的数据格式满足标准的Prometheus数据格式要求即可。
其实,很多组件已经为了适配Prometheus采集指标,添加了对应的/metrics api,比如
CoreDNS:
$ kubectl -n kube-system get po -owide|grep coredns
coredns-58cc8c89f4-nshx2             1/1     Running   6          22d   10.244.0.20
coredns-58cc8c89f4-t9h2r             1/1     Running   7          22d   10.244.0.21

$ curl 10.244.0.20:9153/metrics

[root@k8s-master prometheus]# kubectl -n kube-system get svc
NAME             TYPE        CLUSTER-IP     EXTERNAL-IP   PORT(S)                  AGE
kube-dns         ClusterIP   10.96.0.10     <none>        53/UDP,53/TCP,9153/TCP   6d16h
metrics-server   ClusterIP   10.99.99.169   <none>        443/TCP                  38h
修改target配置:
$ kubectl -n monitor edit configmap prometheus-config
...
    scrape_configs:
      - job_name: 'prometheus'
        static_configs:
        - targets: ['localhost:9090']
      - job_name: 'coredns'
        static_configs:
        - targets: ['10.96.0.10:9153']

#查看配置是否修改了
# kubectl -n monitor exec prometheus-6c8768547-7vh7p -- cat /etc/prometheus/prometheus.yml
# kubectl apply -f prometheus-configmap.yaml #上面在线修改了, 不用运行这条命令

# 等待30s左右,重启Prometheus进程
$ kubectl -n monitor get po -owide
prometheus-5cd4d47557-758r5   1/1     Running   0          12m   10.244.2.63
$ curl -XPOST 10.244.2.63:9090/-/reload

kubectl -n monitor logs -f prometheus-6c8768547-7vh7p


# 浏览器上可查看到新添加的coredns  http://prometheus.luffy.com/targets
监控apiserver等系统组件
常用监控对象的指标采集
对于集群的监控一般我们需要考虑以下几个方面:
- 内部系统组件的状态:比如 kube-apiserver、kube-scheduler、kube-controller-manager、kubedns/coredns 等组件的详细运行状态
- Kubernetes 节点的监控:比如节点的 cpu、load、disk、memory 等指标
- 业务容器基础指标的监控(容器CPU、内存、磁盘等), hpa ,kubelet, advistor
- 业务容器业务指标的监控,业务代码实现了/metrics的api,暴漏业务的指标
- 编排级的 metrics:比如 Deployment 的状态、资源请求、调度和 API 延迟等数据指标
监控kube-apiserver
apiserver自身也提供了/metrics 的api来提供监控数据
$ kubectl get svc
NAME         TYPE        CLUSTER-IP   EXTERNAL-IP   PORT(S)   AGE
kubernetes   ClusterIP   10.96.0.1    <none>        443/TCP   23d

# 获取token
# kubectl -n monitor get sa   # serviceaccounts
NAME         SECRETS   AGE
default      0         <invalid>
prometheus   0         <invalid>
$ kubectl -n monitor create token prometheus

# 使用token请求apiserver
# kubectl -n monitor exec -ti prometheus-6c8768547-7vh7p -- sh
$ cat /var/run/secrets/kubernetes.io/serviceaccount/token
$ curl -k  -H "Authorization: Bearer eyJhbGciOiJSUzI1NiIsImtpZCI6InFQRmxuWUd5UU9fTVhnSktxQjhOTUJmanZpX25RSFpoWXNwWl9xdDNRcGsifQ.eyJhdWQiOlsiaHR0cHM6Ly9rdWJlcm5ldGVzLmRlZmF1bHQuc3ZjLmNsdXN0ZXIubG9jYWwiXSwiZXhwIjoxNzYxMjk1NDcyLCJpYXQiOjE3Mjk3NTk0NzIsImlzcyI6Imh0dHBzOi8va3ViZXJuZXRlcy5kZWZhdWx0LnN2Yy5jbHVzdGVyLmxvY2FsIiwia3ViZXJuZXRlcy5pbyI6eyJuYW1lc3BhY2UiOiJtb25pdG9yIiwicG9kIjp7Im5hbWUiOiJwcm9tZXRoZXVzLTZjODc2ODU0Ny1yaDQ5eiIsInVpZCI6IjYyNWZhYmMzLTdkZTAtNGRhNC04MmVmLTU2MWVlODI5N2VlNyJ9LCJzZXJ2aWNlYWNjb3VudCI6eyJuYW1lIjoicHJvbWV0aGV1cyIsInVpZCI6ImIwZjk5ZDdmLTU3ZjItNGJlZC05ZjU1LTIxYjc1M2JmOGE5MyJ9LCJ3YXJuYWZ0ZXIiOjE3Mjk3NjMwNzl9LCJuYmYiOjE3Mjk3NTk0NzIsInN1YiI6InN5c3RlbTpzZXJ2aWNlYWNjb3VudDptb25pdG9yOnByb21ldGhldXMifQ.cwShfc5WNUnWbdSm09oB05kmZVBiVz8BS_XzB-_zMHekSLlVe_Ooxcuav8MZQhnpLcji8gUnaZqBdBTcs22fEEf0jIRVCXpu7-GsfWHdMGSxMyL9Q6oXl1Q12Hah3Qp75qAe0wmdzuHDTmTbKWoVhg_0vuB9BxOjC-uUYdBIFkml9Dxwzf62bschAgASNOSe3_RvMYplScRH_S-2t0pgjlH_9xPBBASYcjab9IXA9M6YU_zbdP0okFW6mUNtJWb1rrMm97lezD-0upShlMQyWyDxEWhL3DGZvKgX2fbHnNaRf0uuEeDYICHLJFBpvX6nUIU-KTijit3S-rSewajrng" https://10.96.0.1/metrics

# kubectl describe svc kubernetes
Name:              kubernetes
Namespace:         default
Labels:            component=apiserver
                   provider=kubernetes
Annotations:       <none>
Selector:          <none>
Type:              ClusterIP
IP Family Policy:  SingleStack
IP Families:       IPv4
IP:                10.96.0.1
IPs:               10.96.0.1
Port:              https  443/TCP
TargetPort:        6443/TCP
Endpoints:         172.16.1.226:6443
Session Affinity:  None
Events:            <none>


# kubectl -n monitor get po
NAME                         READY   STATUS    RESTARTS   AGE
prometheus-6c8768547-7vh7p   1/1     Running   0          <invalid>
#等30秒 配置文件会更新到prometheus容器里
# kubectl -n monitor exec -ti prometheus-6c8768547-7vh7p -- cat /etc/prometheus/prometheus.yml
# kubectl -n monitor exec -ti prometheus-6c8768547-7vh7p -- sh
/prometheus $ df -h
/prometheus $ cat /var/run/secrets/kubernetes.io/serviceaccount/token
可以通过手动配置如下job来试下对apiserver服务的监控,
$ kubectl -n monitor edit configmap prometheus-config
...
      - job_name: 'kubernetes-apiserver'
        static_configs:
        - targets: ['10.96.0.1']
        scheme: https
        tls_config:
          ca_file: /var/run/secrets/kubernetes.io/serviceaccount/ca.crt
          insecure_skip_verify: true
        bearer_token_file: /var/run/secrets/kubernetes.io/serviceaccount/token


# 等待30s左右,重启Prometheus进程
$ kubectl -n monitor get po -owide
prometheus-5cd4d47557-758r5   1/1     Running   0          12m   10.244.2.63
$ curl -XPOST 10.244.2.63:9090/-/reload  #加载配置


------------------------------报错信息
/prometheus $ cat /etc/prometheus/prometheus.yml
# my global config
global:
  scrape_interval: 30s
  evaluation_interval: 30s
  # scrape_timeout is set to the global default (10s).

# Alertmanager configuration
alerting:
  alertmanagers:
  - static_configs:
    - targets:
      # - alertmanager:9093

# Load rules once and periodically evaluate them according to the global 'evaluation_interval'.
rule_files:
  # - "first_rules.yml"
  # - "second_rules.yml"

# A scrape configuration containing exactly one endpoint to scrape:
# Here it's Prometheus itself.
scrape_configs:
  - job_name: 'prometheus'
    static_configs:
    - targets: ['localhost:9090']
  - job_name: 'coredns'
    static_configs:
    - targets: ['10.96.0.10:9153']
  - job_name: 'kubernetes-apiserver'
    static_configs:
    - targets: ['10.96.0.1']
      scheme: https
      tls_config:
        ca_file: /var/run/secrets/kubernetes.io/serviceaccount/ca.crt
        insecure_skip_verify: true
      bearer_token_file: /var/run/secrets/kubernetes.io/serviceaccount/token

上面是prometheus的配置文件
[root@k8s-master prometheus]# kubectl -n monitor get po -owide
NAME                         READY   STATUS    RESTARTS   AGE   IP            NODE         NOMINATED NODE   READINESS GATES
prometheus-6c8768547-rh49z   1/1     Running   0          41m   10.244.1.72   k8s-slave1   <none>           <none>
[root@k8s-master prometheus]# curl -XPOST 10.244.1.72:9090/-/reload
failed to reload config: couldn't load configuration (--config.file="/etc/prometheus/prometheus.yml"): parsing YAML file /etc/prometheus/prometheus.yml: yaml: unmarshal errors:
  line 31: field scheme not found in type struct { Targets []string "yaml:\"targets\""; Labels model.LabelSet "yaml:\"labels\"" }
  line 32: field tls_config not found in type struct { Targets []string "yaml:\"targets\""; Labels model.LabelSet "yaml:\"labels\"" }
  line 35: field bearer_token_file not found in type struct { Targets []string "yaml:\"targets\""; Labels model.LabelSet "yaml:\"labels\"" }

配置文件加载错误?, 重新检查了很多遍 依然报错
宿主机指标
监控集群节点基础指标
node_exporter https://github.com/prometheus/node_exporter
分析:
- 每个节点都需要监控,因此可以使用DaemonSet类型来管理node_exporter
- 添加节点的容忍配置
- 挂载宿主机中的系统文件信息
cat <<\EOF > node-exporter.ds.yaml
apiVersion: apps/v1
kind: DaemonSet
metadata:
  name: node-exporter
  namespace: monitor
  labels:
    app: node-exporter
spec:
  selector:
    matchLabels:
      app: node-exporter
  template:
    metadata:
      labels:
        app: node-exporter
    spec:
      hostPID: true
      hostIPC: true
      hostNetwork: true
      nodeSelector:
        kubernetes.io/os: linux
      containers:
      - name: node-exporter
        image: prom/node-exporter:v1.0.1   #v1.4.0
        args:
        - --web.listen-address=$(HOSTIP):9100
        - --path.procfs=/host/proc
        - --path.sysfs=/host/sys
        - --path.rootfs=/host/root
        - --collector.filesystem.ignored-mount-points=^/(dev|proc|sys|var/lib/docker/.+)($|/)
        - --collector.filesystem.ignored-fs-types=^(autofs|binfmt_misc|cgroup|configfs|debugfs|devpts|devtmpfs|fusectl|hugetlbfs|mqueue|overlay|proc|procfs|pstore|rpc_pipefs|securityfs|sysfs|tracefs)$
        ports:
        - containerPort: 9100
        env:
        - name: HOSTIP
          valueFrom:
            fieldRef:
              fieldPath: status.hostIP
        resources:
          requests:
            cpu: 150m
            memory: 180Mi
          limits:
            cpu: 150m
            memory: 180Mi
        securityContext:
          runAsNonRoot: true
          runAsUser: 65534
        volumeMounts:
        - name: proc
          mountPath: /host/proc
        - name: sys
          mountPath: /host/sys
        - name: root
          mountPath: /host/root
          mountPropagation: HostToContainer
          readOnly: true
      tolerations:
      - operator: "Exists"
      volumes:
      - name: proc
        hostPath:
          path: /proc
      - name: dev
        hostPath:
          path: /dev
      - name: sys
        hostPath:
          path: /sys
      - name: root
        hostPath:
          path: /
EOF
创建node-exporter服务
kubectl apply -f node-exporter.ds.yaml

$ kubectl -n monitor get po -owide
NAME               READY   STATUS    RESTARTS   AGE     IP        NODE         NOMINATED NODE
node-exporter-55kdr          1/1     Running   0          2m39s   172.16.1.228   k8s-slave2   <none>
node-exporter-8x4xh          1/1     Running   0          2m39s   172.16.1.226   k8s-master   <none>
node-exporter-nmf76          1/1     Running   0          2m39s   172.16.1.227   k8s-slave1   <none>

$ curl 172.16.1.226:9100/metrics

curl 172.16.1.226:9100/metrics  |grep nodel_load
问题来了,如何添加到Prometheus的target中?
- 配置一个Service,后端挂载node-exporter的服务,把Service的地址配置到target中
- 带来新的问题,target中无法直观的看到各节点node-exporter的状态
- 把每个node-exporter的服务都添加到target列表中
- 带来新的问题,集群节点的增删,都需要手动维护列表
- target列表维护量随着集群规模增加
Prometheus的服务发现与Relabeling
之前已经给Prometheus配置了RBAC,有读取node的权限,因此Prometheus可以去调用Kubernetes API获取node信息,所以Prometheus通过与 Kubernetes API 集成,提供了内置的服务发现分别是:Node、Service、Pod、Endpoints、Ingress
配置job即可:
# kubectl -n monitor edit cm prometheus-config
.... 下面增加内容
     - job_name: 'kubernetes-sd-node-exporter'
        kubernetes_sd_configs:
          - role: node

# 等30秒查看配置更新了
# kubectl -n monitor exec prometheus-6c8768547-rh49z -- cat /etc/prometheus/prometheus.yml
# curl -XPOST 10.244.1.72:9090/-/reload  #软加载配置
重新reload后查看效果:
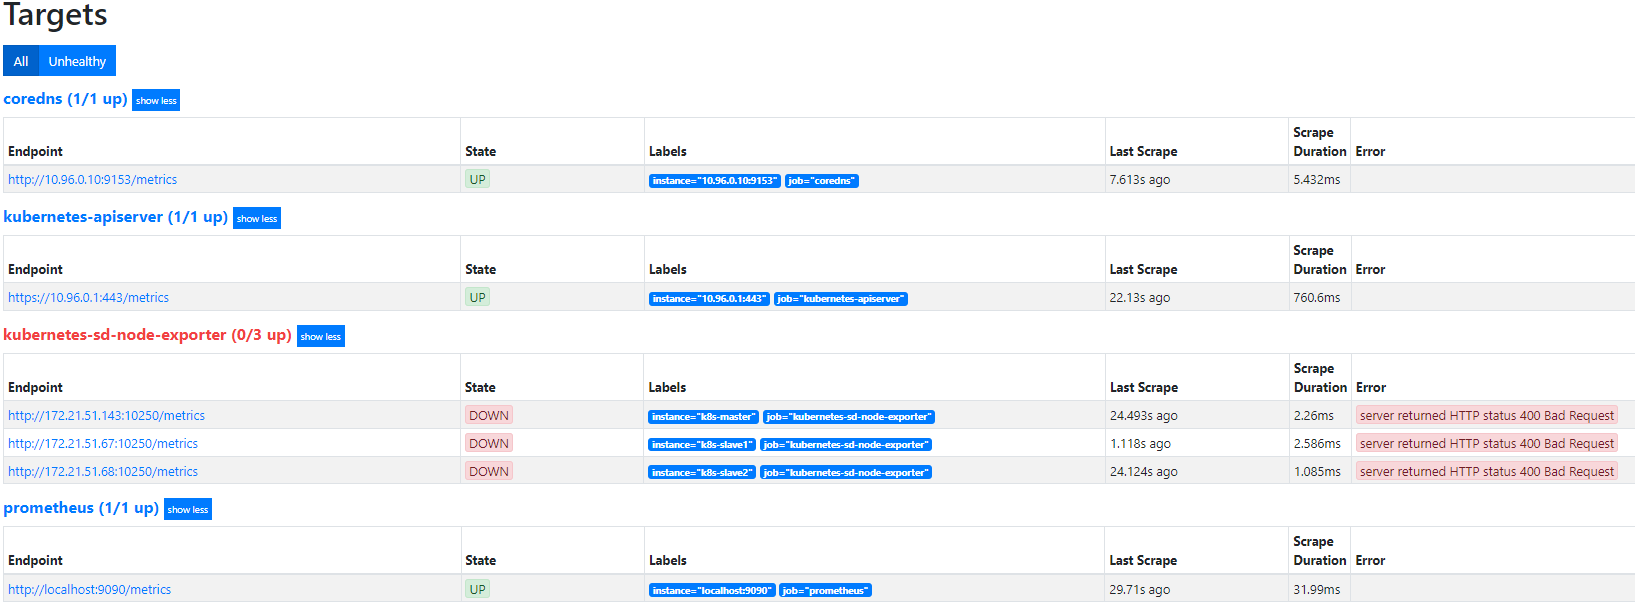
默认访问的地址是http://node-ip/10250/metrics,10250是kubelet API的服务端口,说明Prometheus的node类型的服务发现模式,默认是和kubelet的10250绑定的,而我们是期望使用node-exporter作为采集的指标来源,因此需要把访问的endpoint替换成http://node-ip:9100/metrics。

在真正抓取数据前,Prometheus提供了relabeling的能力。怎么理解?
查看Target的Label列,可以发现,每个target对应会有很多Before Relabeling的标签,这些__开头的label是系统内部使用,不会存储到样本的数据里,但是,我们在查看数据的时候,可以发现,每个数据都有两个默认的label,即:
instance的值其实则取自于__address__
这种发生在采集样本数据之前,对Target实例的标签进行重写的机制在Prometheus被称为Relabeling。
因此,利用relabeling的能力,只需要将__address__替换成node_exporter的服务地址即可。
# kubectl -n monitor edit cm prometheus-config
.... 下面增加内容
      - job_name: 'kubernetes-sd-node-exporter'
        kubernetes_sd_configs:
          - role: node
        relabel_configs:
        - source_labels: [__address__]
          regex: '(.*):10250'
          replacement: '${1}:9100'
          target_label: __address__
          action: replace

# 等30秒查看配置更新了
# kubectl -n monitor exec prometheus-6c8768547-rh49z -- cat /etc/prometheus/prometheus.yml
# curl -XPOST 10.244.1.72:9090/-/reload  #软加载配置
再次更新Prometheus服务后,查看targets列表及node-exporter提供的指标,node_load1
容器指标采集
使用cadvisor实现容器指标的采集(新)
目前cAdvisor集成到了kubelet组件内 ,因此可以通过kubelet的接口实现容器指标的采集,具体的API为:
https://<node-ip>:10250/metrics/cadvisor    # node上的cadvisor采集到的容器指标
https://<node-ip>:10250/metrics             # node上的kubelet的指标数据

# 可以通过curl -k  -H "Authorization: Bearer xxxx" https://xxxx/xx查看
因此,针对容器指标来讲,我们期望的采集target是:
https://172.21.51.143:10250/metrics/cadvisor
https://172.21.51.67:10250/metrics/cadvisor
https://172.21.51.68:10250/metrics/cadvisor
即每个node节点都需要去采集数据,联想到prometheus的服务发现中的node类型,因此,配置:
默认添加的target列表为:__schema__://__address__ __metrics_path__
http://172.21.51.143:10250/metrics
http://172.21.51.67:10250/metrics
http://172.21.51.68:10250/metrics
# 可以通过curl -k -H "Authorization: Bearer xxxx" https://xxxx/xx查看
和期望值不同的是__schema__和__metrics_path__,针对__metrics_path__可以使用relabel修改:
针对__schema__:
# kubectl -n monitor edit cm prometheus-config
.... 下面增加内容
    - job_name: 'kubernetes-sd-cadvisor'
      kubernetes_sd_configs:
        - role: node
scheme: https
tls_config:
ca_file: /var/run/secrets/kubernetes.io/serviceaccount/ca.crt
insecure_skip_verify: true
bearer_token_file: /var/run/secrets/kubernetes.io/serviceaccount/token
      relabel_configs:
      - target_label: __metrics_path__
        replacement: /metrics/cadvisor
# 等30秒查看配置更新了
# kubectl -n monitor exec prometheus-6c8768547-rh49z -- cat /etc/prometheus/prometheus.yml
# curl -XPOST 10.244.1.72:9090/-/reload #软加载配置
重新应用配置,然后重建Prometheus的pod。查看targets列表,查看cadvisor指标,比如container_cpu_system_seconds_total,container_memory_usage_bytes
综上,利用node类型的服务发现,可以实现对daemonset类型服务的目标自动发现以及监控数据抓取。
补充:
若想采集kubelet的指标:
# kubectl -n monitor edit cm prometheus-config
.... 下面增加内容
      - job_name: 'kubernetes-sd-kubelet'
        kubernetes_sd_configs:
          - role: node
        scheme: https
        tls_config:
          ca_file: /var/run/secrets/kubernetes.io/serviceaccount/ca.crt
          insecure_skip_verify: true
        bearer_token_file: /var/run/secrets/kubernetes.io/serviceaccount/token

# 等30秒查看配置更新了
# kubectl -n monitor exec prometheus-6c8768547-rh49z -- cat /etc/prometheus/prometheus.yml
# curl -XPOST 10.244.1.72:9090/-/reload  #软加载配置
k8s Service服务的监控指标采集
比如集群中存在100个业务应用,每个业务应用都需要被Prometheus监控。
每个服务是不是都需要手动添加配置?有没有更好的方式?
      - job_name: 'kubernetes-sd-endpoints'
        kubernetes_sd_configs:
          - role: endpoints

# kubectl -n monitor edit cm prometheus-config
# 等30秒 查看修改的配置是否更新上去
# kubectl -n monitor exec prometheus-6c8768547-rh49z -- cat /etc/prometheus/prometheus.yml
# curl -XPOST 10.244.1.72:9090/-/reload  #软加载配置

# kubectl get ep -A #并不是所有endpoint都实现了metrics接口
reload prometheush,此使的Target列表中,kubernetes-sd-endpoints下出现了N多条数据,
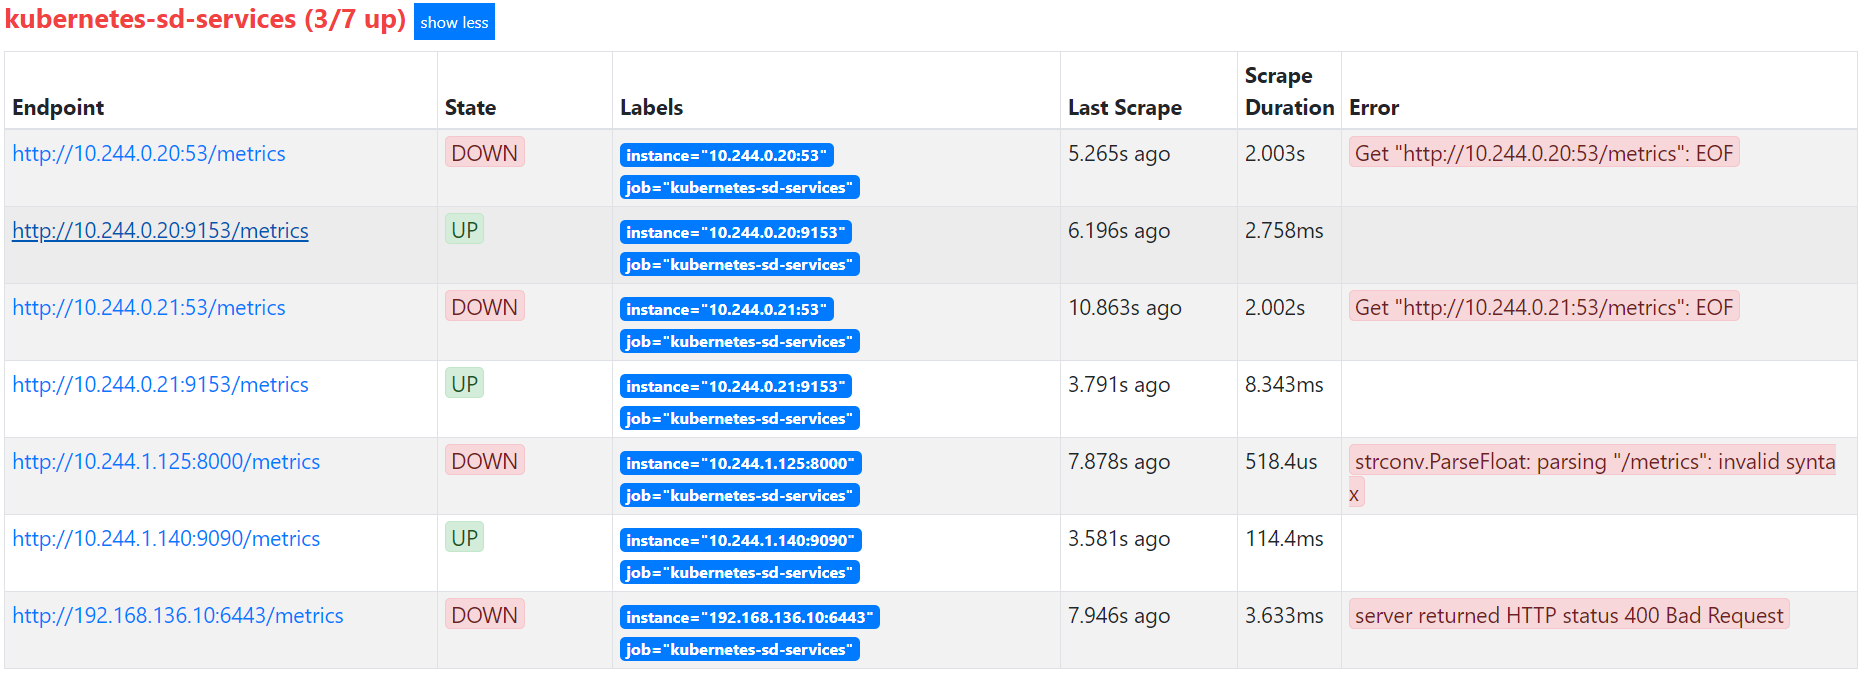
可以发现,实际上endpoint这个类型,目标是去抓取整个集群中所有的命名空间的Endpoint列表,然后使用默认的/metrics进行数据抓取,我们可以通过查看集群中的所有ep列表来做对比:
但是实际上并不是每个服务都已经实现了/metrics监控的,也不是每个实现了/metrics接口的服务都需要注册到Prometheus中,因此,我们需要一种方式对需要采集的服务实现自主可控。这就需要利用relabeling中的keep功能。

我们知道,relabel的作用对象是target的Before Relabling标签,比如说,假如通过如下定义:
  - job_name: 'kubernetes-sd-endpoints'
    kubernetes_sd_configs:
    - role: endpoints
    relabel_configs:
    - source_labels: [__meta_kubernetes_service_annotation_prometheus_io_scrape]
      action: keep
      regex: true


# kubectl -n monitor edit cm prometheus-config
# 等待30秒 查看修改的配置是否更新上去
# kubectl -n monitor exec prometheus-6c8768547-rh49z -- cat /etc/prometheus/prometheus.yml
# curl -XPOST 10.244.1.72:9090/-/reload  #软加载配置
那么就可以实现target的Before Relabling中若存在__meta_kubernetes_service_annotation_prometheus_io_scrape,且值为true的话,则会加入到kubernetes-sd-endpoints这个target中,否则就会被删除。
因此可以为我们期望被采集的服务,加上对应的Prometheus的label即可。
问题来了,怎么加?
查看coredns的metrics类型Before Relabling中的值,可以发现,存在如下类型的Prometheus的标签:
__meta_kubernetes_service_annotation_prometheus_io_scrape="true"
__meta_kubernetes_service_annotation_prometheus_io_port="9153"
这些内容是如何生成的呢,查看coredns对应的服务属性:
$ kubectl -n kube-system get service kube-dns -oyaml
apiVersion: v1
kind: Service
metadata:
  annotations:
    prometheus.io/port: "9153"
    prometheus.io/scrape: "true"
  creationTimestamp: "2021-06-06T02:39:44Z"
  labels:
    k8s-app: kube-dns
    kubernetes.io/cluster-service: "true"
    kubernetes.io/name: KubeDNS
  name: kube-dns
  namespace: kube-system
  ...
发现存在annotations声明,因此,可以联想到二者存在对应关系,Service的定义中的annotations里的特殊字符会被转换成Prometheus中的label中的下划线。
我们即可以使用如下配置,来定义服务是否要被抓取监控数据。
      - job_name: 'kubernetes-sd-endpoints'
        kubernetes_sd_configs:
        - role: endpoints
        relabel_configs:
        - source_labels: [__meta_kubernetes_service_annotation_prometheus_io_scrape]
          action: keep
          regex: true


# kubectl -n monitor edit cm prometheus-config
# 查看修改的配置是否更新上去
# kubectl -n monitor exec prometheus-6c8768547-rh49z -- cat /etc/prometheus/prometheus.yml
# curl -XPOST 10.244.1.72:9090/-/reload  #软加载配置
这样的话,我们只需要为服务定义上如下的声明,即可实现Prometheus自动采集数据
有些时候,我们业务应用提供监控数据的path地址并不一定是/metrics,如何实现兼容?
同样的思路,我们知道,Prometheus会默认使用Before Relabling中的__metrics_path作为采集路径,因此,我们再自定义一个annotation,prometheus.io/path
# kubectl -n kube-system edit svc kube-dns
  annotations:
    prometheus.io/scrape: "true"
prometheus.io/path: "/path/to/metrics" #增加内容
这样,Prometheus端会自动生成如下标签:
我们只需要在relabel_configs中用该标签的值,去重写__metrics_path__的值即可。因此:
  - job_name: 'kubernetes-sd-endpoints'
    kubernetes_sd_configs:
    - role: endpoints
    relabel_configs:
    - source_labels: [__meta_kubernetes_service_annotation_prometheus_io_scrape]
      action: keep
      regex: true
    - source_labels: [__meta_kubernetes_service_annotation_prometheus_io_path]
      action: replace
      target_label: __metrics_path__
      regex: (.+)


# kubectl -n monitor edit cm prometheus-config
# 等待30秒 查看修改的配置是否更新上去
# kubectl -n monitor exec prometheus-6c8768547-rh49z -- cat /etc/prometheus/prometheus.yml
# curl -XPOST 10.244.1.72:9090/-/reload  #软加载配置
有些时候,业务服务的metrics是独立的端口,比如coredns,业务端口是53,监控指标采集端口是9153,这种情况,如何处理?
很自然的,我们会想到通过自定义annotation来处理,
# kubectl -n kube-system edit svc kube-dns
  annotations:
    prometheus.io/scrape: "true"
    prometheus.io/path: "ss/metrics"  #修改成/metrics
    prometheus.io/port: "9153"


# http://prometheus.luffy.com/targets #页面查看 路径变更了
如何去替换?
我们知道Prometheus默认使用Before Relabeling中的__address__进行作为服务指标采集的地址,但是该地址的格式通常是这样的
我们的目标是将如下两部分拼接在一起:
- 10.244.0.20
- prometheus.io/port定义的值,即
__meta_kubernetes_service_annotation_prometheus_io_port的值
因此,需要使用正则规则取出上述两部分:
  - source_labels: [__address__, __meta_kubernetes_service_annotation_prometheus_io_port]
    action: replace
    target_label: __address__
    regex: ([^:]+)(?::\d+)?;(\d+)
    replacement: $1:$2

# kubectl -n monitor edit cm prometheus-config
# 等待30秒 查看修改的配置是否更新上去
# kubectl -n monitor exec prometheus-6c8768547-rh49z -- cat /etc/prometheus/prometheus.yml
# curl -XPOST 10.244.1.72:9090/-/reload  #软加载配置

# kubectl -n monitor edit cm prometheus-config   # 删除掉coredns
      - job_name: 'coredns'
        static_configs:
        - targets: ['10.244.0.55:9153']

# 等待30秒 查看修改的配置是否更新上去
# kubectl -n monitor exec prometheus-6c8768547-rh49z -- cat /etc/prometheus/prometheus.yml
# curl -XPOST 10.244.1.72:9090/-/reload  #软加载配置
需要注意的几点:
__address__中的:<port>有可能不存在,因此,使用()?的匹配方式进行- 表达式中,三段
()我们只需要第一和第三段,不需要中间括号部分的内容,因此使用?:的方式来做非获取匹配,即可以匹配内容,但是不会被记录到$1,$2这种变量中 - 多个source_labels中间默认使用
;号分割,因此匹配的时候需要注意添加;号
此外,还可以将before relabeling 中的更多常用的字段取出来添加到目标的label中,比如:
  - source_labels: [__meta_kubernetes_namespace]
    action: replace
    target_label: kubernetes_namespace
  - source_labels: [__meta_kubernetes_service_name]
    action: replace
    target_label: kubernetes_service_name
  - source_labels: [__meta_kubernetes_pod_name]
    action: replace
    target_label: kubernetes_pod_name
因此,目前的relabel的配置如下:
      - job_name: 'kubernetes-sd-endpoints'
        kubernetes_sd_configs:
        - role: endpoints
        relabel_configs:
        - source_labels: [__meta_kubernetes_service_annotation_prometheus_io_scrape]
          action: keep
          regex: true
        - source_labels: [__meta_kubernetes_service_annotation_prometheus_io_path]
          action: replace
          target_label: __metrics_path__
          regex: (.+)
        - source_labels: [__address__, __meta_kubernetes_service_annotation_prometheus_io_port]
          action: replace
          target_label: __address__
          regex: ([^:]+)(?::\d+)?;(\d+)
          replacement: $1:$2
        - source_labels: [__meta_kubernetes_namespace]
          action: replace
          target_label: kubernetes_namespace
        - source_labels: [__meta_kubernetes_service_name]
          action: replace
          target_label: kubernetes_service_name
        - source_labels: [__meta_kubernetes_pod_name]
          action: replace
          target_label: kubernetes_pod_name

-----------------完整版
[root@k8s-master prometheus]# kubectl -n monitor exec prometheus-6c8768547-rh49z -- cat /etc/prometheus/prometheus.yml
Defaulted container "prometheus" out of: prometheus, change-permission-of-directory (init)
# my global config
global:
  scrape_interval: 30s
  evaluation_interval: 30s
  # scrape_timeout is set to the global default (10s).

# Alertmanager configuration
alerting:
  alertmanagers:
  - static_configs:
    - targets:
      # - alertmanager:9093

# Load rules once and periodically evaluate them according to the global 'evaluation_interval'.
rule_files:
  # - "first_rules.yml"
  # - "second_rules.yml"

# A scrape configuration containing exactly one endpoint to scrape:
# Here it's Prometheus itself.
scrape_configs:
  - job_name: 'prometheus'
    static_configs:
    - targets: ['localhost:9090']
  - job_name: 'coredns'
    static_configs:
    - targets: ['10.96.0.10:9153']
  - job_name: 'kubernetes-sd-node-exporter'
    kubernetes_sd_configs:
      - role: node
    relabel_configs:
    - source_labels: [__address__]
      regex: '(.*):10250'
      replacement: '${1}:9100'
      target_label: __address__
      action: replace
  - job_name: 'kubernetes-sd-cadvisor'
    kubernetes_sd_configs:
      - role: node
    scheme: https
    tls_config:
      ca_file: /var/run/secrets/kubernetes.io/serviceaccount/ca.crt
      insecure_skip_verify: true
    bearer_token_file: /var/run/secrets/kubernetes.io/serviceaccount/token
    relabel_configs:
    - target_label: __metrics_path__
      replacement: /metrics/cadvisor
  - job_name: 'kubernetes-sd-kubelet'
    kubernetes_sd_configs:
      - role: node
    scheme: https
    tls_config:
      ca_file: /var/run/secrets/kubernetes.io/serviceaccount/ca.crt
      insecure_skip_verify: true
    bearer_token_file: /var/run/secrets/kubernetes.io/serviceaccount/token
  - job_name: 'kubernetes-sd-endpoints'
    kubernetes_sd_configs:
    - role: endpoints
    relabel_configs:
    - source_labels: [__meta_kubernetes_service_annotation_prometheus_io_scrape]
      action: keep
      regex: true
    - source_labels: [__meta_kubernetes_service_annotation_prometheus_io_path]
      action: replace
      target_label: __metrics_path__
      regex: (.+)
    - source_labels: [__address__, __meta_kubernetes_service_annotation_prometheus_io_port]
      action: replace
      target_label: __address__
      regex: ([^:]+)(?::\d+)?;(\d+)
      replacement: $1:$2
    - source_labels: [__meta_kubernetes_namespace]
      action: replace
      target_label: kubernetes_namespace
    - source_labels: [__meta_kubernetes_service_name]
      action: replace
      target_label: kubernetes_service_name
    - source_labels: [__meta_kubernetes_pod_name]
      action: replace
      target_label: kubernetes_pod_name

---------------------
验证一下:
更新configmap并重启Prometheus服务,查看target列表。
kube-state-metrics监控
已经有了cadvisor,容器运行的指标已经可以获取到,但是下面这种情况却无能为力:
- 我调度了多少个replicas?现在可用的有几个?
- 多少个Pod是running/stopped/terminated状态?
- Pod重启了多少次?
而这些则是kube-state-metrics提供的内容,它基于client-go开发,轮询Kubernetes API,并将Kubernetes的结构化信息转换为metrics。因此,需要借助于kube-state-metrics来实现。
指标类别包括:
- CronJob Metrics
- DaemonSet Metrics
- Deployment Metrics
- Job Metrics
- LimitRange Metrics
- Node Metrics
- PersistentVolume Metrics
- PersistentVolumeClaim Metrics
- Pod Metrics
- kube_pod_info
- kube_pod_owner
- kube_pod_status_phase
- kube_pod_status_ready
- kube_pod_status_scheduled
- kube_pod_container_status_waiting
- kube_pod_container_status_terminated_reason
- ...
- Pod Disruption Budget Metrics
- ReplicaSet Metrics
- ReplicationController Metrics
- ResourceQuota Metrics
- Service Metrics
- StatefulSet Metrics
- Namespace Metrics
- Horizontal Pod Autoscaler Metrics
- Endpoint Metrics
- Secret Metrics
- ConfigMap Metrics
部署: https://github.com/kubernetes/kube-state-metrics#kubernetes-deployment
$ wget https://github.com/kubernetes/kube-state-metrics/archive/v2.1.0.tar.gz
# wget https://gitee.com/chengkanghua/script/raw/master/kube-state-metrics-2.1.0.tar.gz #备用地址


tar zxf kube-state-metrics-2.1.0.tar.gz
cd kube-state-metrics-2.1.0/examples/standard/


$ ll standard/
total 20
-rw-r--r-- 1 root root  376 Jun 24 20:49 cluster-role-binding.yaml
-rw-r--r-- 1 root root 1623 Jun 24 20:49 cluster-role.yaml
-rw-r--r-- 1 root root 1134 Jun 24 20:49 deployment.yaml
-rw-r--r-- 1 root root  192 Jun 24 20:49 service-account.yaml
-rw-r--r-- 1 root root  405 Jun 24 20:49 service.yaml

# 替换namespace为monitor
sed -i 's/namespace: kube-system/namespace: monitor/g' *

# 替换镜像地址为image: bitnami/kube-state-metrics:2.1.0
sed -i 's#k8s.gcr.io/kube-state-metrics/kube-state-metrics:v2.1.0#bitnami/kube-state-metrics:2.1.0#g' deployment.yaml

$ kubectl apply -f .
clusterrolebinding.rbac.authorization.k8s.io/kube-state-metrics created
clusterrole.rbac.authorization.k8s.io/kube-state-metrics created
deployment.apps/kube-state-metrics created
serviceaccount/kube-state-metrics created
service/kube-state-metrics created
如何添加到Prometheus监控target中?
$ vi service.yaml
apiVersion: v1
kind: Service
metadata:
  annotations:#新增加
    prometheus.io/scrape: "true"
    prometheus.io/port: "8080"
  labels:
    app.kubernetes.io/name: kube-state-metrics
    app.kubernetes.io/version: 2.1.0
  name: kube-state-metrics
  namespace: monitor
spec:
  clusterIP: None
  ports:
  - name: http-metrics
    port: 8080
    targetPort: http-metrics
  - name: telemetry
    port: 8081
    targetPort: telemetry
  selector:
    app.kubernetes.io/name: kube-state-metrics

$ kubectl apply -f service.yaml

[root@k8s-master standard]# kubectl -n monitor get po -owide
NAME                                 READY   STATUS    RESTARTS   AGE     IP             NODE
kube-state-metrics-7dc6bc9d6-89cf2   1/1     Running   0          3m45s   10.244.2.68    k8s-slave2
查看target列表,观察是否存在kube-state-metrics的target。
kube_pod_container_status_running
kube_deployment_status_replicas
kube_deployment_status_replicas_unavailable
Grafana
可视化面板,功能齐全的度量仪表盘和图形编辑器,支持 Graphite、zabbix、InfluxDB、Prometheus、OpenTSDB、Elasticsearch 等作为数据源,比 Prometheus 自带的图表展示功能强大太多,更加灵活,有丰富的插件,功能更加强大。
安装
注意点:
- 使用最新版本的镜像 https://github.com/grafana/grafana
- 通过环境变量设置管理员账户密码
- GF_SECURITY_ADMIN_USER
- GF_SECURITY_ADMIN_PASSWORD
- 通过设置securityContext的方式让grafana进程使用root启动
- 数据挂载到本地
- 配置ingress暴露访问入口
cat <<\EOF > grafana-all.yaml
kind: PersistentVolumeClaim
apiVersion: v1
metadata:
  name: grafana
  namespace: monitor
spec:
  accessModes:
    - ReadWriteOnce
  storageClassName: nfs
  resources:
    requests:
      storage: 200Gi
---
apiVersion: apps/v1
kind: Deployment
metadata:
  name: grafana
  namespace: monitor
spec:
  selector:
    matchLabels:
      app: grafana
  template:
    metadata:
      labels:
        app: grafana
    spec:
      volumes:
      - name: storage
        persistentVolumeClaim:
          claimName: grafana
      securityContext:
        runAsUser: 0
      containers:
      - name: grafana
        image: grafana/grafana:7.5.9
        imagePullPolicy: IfNotPresent
        ports:
        - containerPort: 3000
          name: grafana
        env:
        - name: GF_SECURITY_ADMIN_USER
          value: admin
        - name: GF_SECURITY_ADMIN_PASSWORD
          value: admin
        readinessProbe:
          failureThreshold: 10
          httpGet:
            path: /api/health
            port: 3000
            scheme: HTTP
          initialDelaySeconds: 60
          periodSeconds: 10
          successThreshold: 1
          timeoutSeconds: 30
        livenessProbe:
          failureThreshold: 3
          httpGet:
            path: /api/health
            port: 3000
            scheme: HTTP
          periodSeconds: 10
          successThreshold: 1
          timeoutSeconds: 1
        resources:
          limits:
            cpu: 150m
            memory: 512Mi
          requests:
            cpu: 150m
            memory: 512Mi
        volumeMounts:
        - mountPath: /var/lib/grafana
          name: storage
---
apiVersion: v1
kind: Service
metadata:
  name: grafana
  namespace: monitor
spec:
  type: ClusterIP
  ports:
    - port: 3000
  selector:
    app: grafana

---
apiVersion: networking.k8s.io/v1
kind: Ingress
metadata:
  name: grafana
  namespace: monitor
spec:
  ingressClassName: nginx
  rules:
  - host: grafana.luffy.com
    http:
      paths:
      - path: /
        pathType: Prefix
        backend:
          service:
            name: grafana
            port:
              number: 3000
EOF


kubectl apply -f grafana-all.yaml
kubectl -n monitor get ing
kubectl -n monitor get po -owide

# 宿主机配置hosts
10.0.0.266 grafana.luffy.com
#浏览器访问  账号密码 admin
配置数据源:
http://grafana.luffy.com/datasources/edit/1/
添加prometheus --> 设置 url http://prometheus:9090 --> save& test

导入数据源
http://grafana.luffy.com/dashboard/import
id : 11074
VictoriaMetrics: 选择刚刚的数据源 Prometheus  ->点击import
如何丰富Grafana监控面板:
- 导入dashboard
- 安装相应的插件
- 自定义监控面板
完善监控面板
导入Dashboard的配置
dashboard: https://grafana.com/grafana/dashboards
- Node Exporter https://grafana.com/grafana/dashboards/11074
DevOpsProdigy KubeGraf插件的使用
除了直接导入Dashboard,我们还可以通过安装插件的方式获得,Configuration -> Plugins可以查看已安装的插件,通过 官方插件列表 我们可以获取更多可用插件。
Kubernetes相关的插件:
DevOpsProdigy KubeGraf 是一个优秀的 Grafana Kubernetes 插件,是 Grafana 官方的 Kubernetes 插件的升级版本,该插件可以用来可视化和分析 Kubernetes 集群的性能,通过各种图形直观的展示了 Kubernetes 集群的主要服务的指标和特征,还可以用于检查应用程序的生命周期和错误日志。
# 进入grafana容器内部执行安装
$ kubectl -n monitor exec -it grafana-587484b84d-grhl5 -- bash
bash-5.0# grafana-cli plugins install devopsprodigy-kubegraf-app 1.5.2
installing devopsprodigy-kubegraf-app @ 1.5.2
from: https://grafana.com/api/plugins/devopsprodigy-kubegraf-app/versions/1.5.2/download
into: /var/lib/grafana/plugins

✔ Installed devopsprodigy-kubegraf-app successfully

Restart grafana after installing plugins . <service grafana-server restart>

# 也可以下载离线包进行安装

# 重建pod生效
$ kubectl -n monitor delete po grafana-587484b84d-grhl5
登录grafana界面,Configuration -> Plugins 中找到安装的插件,点击插件进入插件详情页面,点击 [Enable]按钮启用插件,点击 Set up your first k8s-cluster 创建一个新的 Kubernetes 集群:
- Name:luffy-k8s
- URL:https://kubernetes.default:443
- Access:使用默认的Server(default)
- Skip TLS Verify:勾选,跳过证书合法性校验
- Auth:勾选TLS Client Auth以及With CA Cert,勾选后会下面有三块证书内容需要填写,内容均来自
~/.kube/config文件,需要对文件中的内容做一次base64 解码 - CA Cert:使用config文件中的
certificate-authority-data对应的内容 - Client Cert:使用config文件中的
client-certificate-data对应的内容 - Client Key:使用config文件中的
client-key-data对应的内容
grep certificate-authority-data ~/.kube/config
grep client-certificate-data ~/.kube/config
grep client-key-data ~/.kube/config
面板没有数据怎么办?
- DaemonSet
/pod="(.+?)"/
- Deployment
/pod="(.+?)"/
- Pod
/pod="(.+?)"/
自定义监控面板
通用的监控需求基本上都可以使用第三方的Dashboard来解决,对于业务应用自己实现的指标的监控面板,则需要我们手动进行创建。
调试Panel:直接输入Metrics,查询数据。
如,输入node_load1来查看集群节点最近1分钟的平均负载,直接保存即可生成一个panel
如何根据字段过滤,实现联动效果?
比如想实现根据集群节点名称进行过滤,可以通过如下方式:
-
设置 -> Variables -> Add Variable,添加一个变量node,
-
Name:node
- Label:选择节点
- Data Source:Prometheus
- Query:label_values(kube_node_info,node),可以在页面下方的
Preview of values查看到当前变量的可选值 - Refresh:
On Dashboard Load - Multi-value:true
-
Include All Options:true
-
修改Metrics,$node和变量名字保持一致,意思为自动读取当前设置的节点的名字
再添加一个面板,使用如下的表达式:
Metrics指标类型与PromQL
TSDB的样本分布示意图:
  ^
  │   . . . . . . . . . . . . . . . . .   . .   node_cpu{cpu="cpu0",mode="idle"}
  │     . . . . . . . . . . . . . . . . . . .   node_cpu{cpu="cpu0",mode="system"}
  │     . . . . . . . . . .   . . . . . . . .   node_load1{}
  │     . . . . . . . . . . . . . . . .   . .   node_cpu_seconds_total{...}
  v
    <------------------ 时间 ---------------->
Guage类型:
$ kubectl -n monitor get po -o wide |grep k8s-master
node-exporter-ld6sq    1/1     Running   0          4d3h    172.21.51.143   k8s-master
$ curl -s  172.21.51.143:9100/metrics |grep node_load1
# HELP node_load1 1m load average.
# TYPE node_load1 gauge
node_load1 0.18
# HELP node_load15 15m load average.
# TYPE node_load15 gauge
node_load15 0.37
Gauge类型的指标侧重于反应系统的当前状态。
- 这类指标的样本数据可增可减。
- 常见指标如:node_memory_MemAvailable_bytes(可用内存大小)、node_load1(系统平均负载)
Guage类型的数据,通常直接查询就会有比较直观的业务含义,比如:
- node_load5
- node_memory_MemAvailable_bytes
我们也会对这类数据做简单的处理,比如:
- 过滤其中某些节点
- 对指标进行数学运算
这就是PromQL提供的能力,可以对收集到的数据做聚合、计算等处理。
PromQL( Prometheus Query Language )是Prometheus自定义的一套强大的数据查询语言,除了使用监控指标作为查询关键字以为,还内置了大量的函数,帮助用户进一步对时序数据进行处理。
比如:
- 只显示k8s-master节点的平均负载
- 显示除了k8s-master节点外的其他节点的平均负载
- 正则匹配
- 集群各节点系统内存使用率
((node_memory_MemTotal_bytes - (node_memory_MemFree_bytes + node_memory_Buffers_bytes + node_memory_Cached_bytes))/node_memory_MemTotal_bytes)*100
counter类型:
$ curl -s  172.21.51.67:9100/metrics |grep node_cpu_seconds_total
# HELP node_cpu_seconds_total Seconds the cpus spent in each mode.
# TYPE node_cpu_seconds_total counter
node_cpu_seconds_total{cpu="0",mode="idle"} 294341.02
node_cpu_seconds_total{cpu="0",mode="iowait"} 120.78
node_cpu_seconds_total{cpu="0",mode="irq"} 0
node_cpu_seconds_total{cpu="0",mode="nice"} 0.13
node_cpu_seconds_total{cpu="0",mode="softirq"} 1263.29
counter类型的指标其工作方式和计数器一样,只增不减(除非系统发生重置)。常见的监控指标,如http_requests_total,node_cpu_seconds_total都是Counter类型的监控指标。
通常计数器类型的指标,名称后面都以_total结尾。我们通过理解CPU利用率的PromQL表达式来讲解Counter指标类型的使用。
各节点CPU的平均使用率表达式:
(1- sum(increase(node_cpu_seconds_total{mode="idle"}[2m])) by (instance) / sum(increase(node_cpu_seconds_total{}[2m])) by (instance)) * 100
分析:
node_cpu_seconds_total的指标含义是统计系统运行以来,CPU资源分配的时间总数,单位为秒,是累加的值。比如,直接运行该指标:
其中mode的值和我们平常在系统中执行top命令看到的CPU显示的信息一致:
每个mode对应的含义如下:
user(us) 表示用户态空间或者说是用户进程(running user space processes)使用CPU所耗费的时间。这是日常我们部署的应用所在的层面,最常见常用。system(sy) 表示内核态层级使用CPU所耗费的时间。分配内存、IO操作、创建子进程……都是内核操作。这也表明,当IO操作频繁时,System参数会很高。steal(st) 当运行在虚拟化环境中,花费在其它 OS 中的时间(基于虚拟机监视器 hypervisor 的调度);可以理解成由于虚拟机调度器将 cpu 时间用于其它 OS 了,故当前 OS 无法使用 CPU 的时间。softirq(si) 从系统启动开始,累计到当前时刻,软中断时间irq(hi) 从系统启动开始,累计到当前时刻,硬中断时间nice(ni) 从系统启动开始,累计到当前时刻, 低优先级(低优先级意味着进程 nice 值小于 0)用户态的进程所占用的CPU时间iowait(wa) 从系统启动开始,累计到当前时刻,IO等待时间idle(id) 从系统启动开始,累计到当前时刻,除IO等待时间以外的其它等待时间,亦即空闲时间
我们通过指标拿到的各核心cpu分配的总时长数据,都是瞬时的数据,如何转换成 CPU的利用率?
先来考虑如何我们如何计算CPU利用率,假如我的k8s-master节点是4核CPU,我们来考虑如下场景:
- 过去60秒内每个CPU核心处于idle空闲状态的时长,假如分别为 :
- cpu0:20s
- cpu1:30s
- cpu2:50s
- cpu3:40s
- 则四个核心总共可分配的时长是 4*60=240s
- 实际空闲状态的总时长为20+30+50+40=140s
- 那么我们可以计算出过去1分钟k8s-master节点的CPU利用率为 (1- 140/240) * 100 = 41.7%
因此,我们只需要使用PromQL取出上述过程中的值即可:
# 过滤出当前时间点idle的时长
node_cpu_seconds_total{mode="idle"}

# 使用[1m]取出1分钟区间内的样本值,注意,1m区间要大于prometheus设置的抓取周期,此处会将周期内所以的样本值取出
node_cpu_seconds_total{mode="idle"}[1m]

# 使用increase方法,获取该区间内idle状态的增量值,即1分钟内,mode="idle"状态增加的时长
increase(node_cpu_seconds_total{mode="idle"}[1m])

# 由于是多个cpu核心,因此需要做累加,使用sum函数
sum(increase(node_cpu_seconds_total{mode="idle"}[1m]))

# 由于是多台机器,因此,需要按照instance的值进行分组累加,使用by关键字做分组,这样就获得了1分钟内,每个节点上 所有CPU核心idle状态的增量时长,即前面示例中的”20+30+50+40=140s“
sum(increase(node_cpu_seconds_total{mode="idle"}[1m])) by (instance)

# 去掉mode=idle的过滤条件,即可获取1分钟内,所有状态的cpu获得的增量总时长,即4*60=240s
sum(increase(node_cpu_seconds_total{}[1m])) by (instance)

# 最终的语句
(1- sum(increase(node_cpu_seconds_total{mode="idle"}[1m])) by (instance) / sum(increase(node_cpu_seconds_total{}[1m])) by (instance)) * 100
irate()是基于最后两个数据点计算一个时序指标在一个范围内的每秒递增率 ,举个例子:
<span v-pre>
# 1min内,k8s-master节点的idle状态的cpu分配时长增量值
increase(node_cpu_seconds_total{instance="k8s-master",mode="idle"}[1m])

{cpu="0",instance="k8s-master",job="kubernetes-sd-node-exporter",mode="idle"}    56.5
{cpu="1",instance="k8s-master",job="kubernetes-sd-node-exporter",mode="idle"}    56.04
{cpu="2",instance="k8s-master",job="kubernetes-sd-node-exporter",mode="idle"}    56.6
{cpu="3",instance="k8s-master",job="kubernetes-sd-node-exporter",mode="idle"}    56.5

#以第一条数据为例,说明过去的1分钟,k8s-master节点的第一个CPU核心,有56.5秒的时长是出于idle状态的

# 1min内,k8s-master节点的idle状态的cpu分配每秒的速率
irate(node_cpu_seconds_total{instance="k8s-master",mode="idle"}[1m])
{cpu="0",instance="k8s-master",job="kubernetes-sd-node-exporter",mode="idle"}    0.934
{cpu="1",instance="k8s-master",job="kubernetes-sd-node-exporter",mode="idle"}    0.932
{cpu="2",instance="k8s-master",job="kubernetes-sd-node-exporter",mode="idle"}    0.933
{cpu="3",instance="k8s-master",job="kubernetes-sd-node-exporter",mode="idle"}    0.936
# 该值如何计算的?
# irate会取出样本中的最后两个点来作为增长依据,然后做差值计算,并且除以两个样本间的数据时长,也就是说,我们设置2m,5m取出来的值是一样的,因为只会计算最后两个样本差。
# 以第一条数据为例,表示用irate计算出来的结果是,过去的两分钟内,cpu平均每秒钟有0.934秒的时间是处于idle状态的


# rate会1min内第一个和最后一个样本值为依据,计算方式和irate保持一致
rate(node_cpu_seconds_total{instance="k8s-master",mode="idle"}[1m])
{cpu="0",instance="k8s-master",job="kubernetes-sd-node-exporter",mode="idle"}    0.933
{cpu="1",instance="k8s-master",job="kubernetes-sd-node-exporter",mode="idle"}    0.940
{cpu="2",instance="k8s-master",job="kubernetes-sd-node-exporter",mode="idle"}    0.935
{cpu="3",instance="k8s-master",job="kubernetes-sd-node-exporter",mode="idle"}    0.937

</span>
因此rate的值,相对来讲更平滑,因为计算的是时间段内的平均,更适合于用作告警。
取CPU平均使用率也可以用如下表达式表示:
Alertmanager安装配置
Alertmanager是一个独立的告警模块。
- 接收Prometheus等客户端发来的警报
- 通过分组、删除重复等处理,并将它们通过路由发送给正确的接收器;
- 告警方式可以按照不同的规则发送给不同的模块负责人。Alertmanager支持Email, Slack,等告警方式, 也可以通过webhook接入钉钉等国内IM工具。
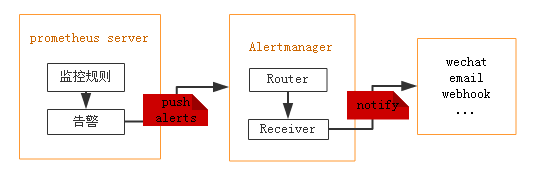
如果集群主机的内存使用率超过80%,且该现象持续了2分钟?想实现这样的监控告警,如何做?
从上图可得知设置警报和通知的主要步骤是:
- 安装和配置 Alertmanager
- 配置Prometheus与Alertmanager对话
- 在Prometheus中创建警报规则
安装
Alertmanager, https://github.com/prometheus/alertmanager#install
alertmanager.yml配置文件格式:
$ cat config.yml
apiVersion: v1
data:
  config.yml: |
    global:
      # 当alertmanager持续多长时间未接收到告警后标记告警状态为 resolved
      resolve_timeout: 5m
      # 配置邮件发送信息
      smtp_smarthost: 'smtp.163.com:25'
      smtp_from: 'earlene163@163.com'
      smtp_auth_username: 'earlene163@163.com'
      smtp_auth_password: 'GENLAXFHNDWNVVVL'
      smtp_require_tls: false
    # 所有报警信息进入后的根路由,用来设置报警的分发策略
    route:
      # 接收到的报警信息里面有许多alertname=NodeLoadHigh 这样的标签的报警信息将会批量被聚合到一个分组里面
      group_by: ['alertname']
      # 当一个新的报警分组被创建后,需要等待至少 group_wait 时间来初始化通知,如果在等待时间内当前group接收到了新的告警,这些告警将会合并为一个通知向receiver发送
      group_wait: 30s

      # 相同的group发送告警通知的时间间隔
      group_interval: 30s
      # 如果一个报警信息已经发送成功了,等待 repeat_interval 时间来重新发送
      repeat_interval: 1m

      # 默认的receiver:如果一个报警没有被一个route匹配,则发送给默认的接收器
      receiver: default

      # 上面所有的属性都由所有子路由继承,并且可以在每个子路由上进行覆盖。
      routes:
      - {}
    # 配置告警接收者的信息
    receivers:
    - name: 'default'
      email_configs:
      - to: '654147123@qq.com'
        send_resolved: true  # 接受告警恢复的通知
kind: ConfigMap
metadata:
  name: alertmanager
  namespace: monitor
主要配置的作用:
- global: 全局配置,包括报警解决后的超时时间、SMTP 相关配置、各种渠道通知的 API 地址等等。
- route: 用来设置报警的分发策略,它是一个树状结构,按照深度优先从左向右的顺序进行匹配。
- receivers: 配置告警消息接受者信息,例如常用的 email、wechat、slack、webhook 等消息通知方式。
当alertmanager接收到一条新的alert时,会先根据group_by为其确定一个聚合组group,然后等待group_wait时间,如果在此期间接收到同一group的其他alert,则这些alert会被合并,然后再发送(alertmanager发送消息单位是group)。此参数的作用是防止短时间内出现大量告警的情况下,接收者被告警淹没。
在该组的alert第一次被发送后,该组会进入睡眠/唤醒周期,睡眠周期将持续group_interval时间,在睡眠状态下该group不会进行任何发送告警的操作(但会插入/更新(根据fingerprint)group中的内容),睡眠结束后进入唤醒状态,然后检查是否需要发送新的alert或者重复已发送的alert(resolved类型的alert在发送完后会从group中剔除)。这就是group_interval的作用。
聚合组在每次唤醒才会检查上一次发送alert是否已经超过repeat_interval时间,如果超过则再次发送该告警。
配置文件:
其他资源清单文件:
$ cat alertmanager-all.yaml
apiVersion: apps/v1
kind: Deployment
metadata:
  name: alertmanager
  namespace: monitor
  labels:
    app: alertmanager
spec:
  selector:
    matchLabels:
      app: alertmanager
  template:
    metadata:
      labels:
        app: alertmanager
    spec:
      volumes:
      - name: config
        configMap:
          name: alertmanager
      containers:
      - name: alertmanager
        image: prom/alertmanager:v0.21.0
        imagePullPolicy: IfNotPresent
        args:
        - "--config.file=/etc/alertmanager/config.yml"
        - "--log.level=debug"
        ports:
        - containerPort: 9093
          name: http
        volumeMounts:
        - mountPath: "/etc/alertmanager"
          name: config
        resources:
          requests:
            cpu: 100m
            memory: 256Mi
          limits:
            cpu: 100m
            memory: 256Mi
---
apiVersion: v1
kind: Service
metadata:
  name: alertmanager
  namespace: monitor
spec:
  type: ClusterIP
  ports:
    - port: 9093
  selector:
    app: alertmanager

---
apiVersion: networking.k8s.io/v1
kind: Ingress
metadata:
  name: alertmanager
  namespace: monitor
spec:
  rules:
  - host: alertmanager.luffy.com
    http:
      paths:
      - path: /
        pathType: Prefix
        backend:
          service:
            name: alertmanager
            port:
              number: 9093
配置Prometheus与Alertmanager对话
是否告警是由Prometheus进行判断的,若有告警产生,Prometheus会将告警push到Alertmanager,因此,需要在Prometheus端配置alertmanager的地址:
因此,修改Prometheus的配置文件,然后重新加载pod
# 编辑prometheus-configmap.yaml配置,添加alertmanager内容
$ kuectl -n monitor edit configmap prometheus-config
apiVersion: v1
kind: ConfigMap
metadata:
name: prometheus-config
namespace: monitor
data:
prometheus.yml: |
global:
scrape_interval: 30s
evaluation_interval: 30s
    alerting:
      alertmanagers:
      - static_configs:
        - targets:
          - alertmanager:9093
...
$ kubectl apply -f prometheus-configmap.yaml
# 现在已经有监控数据了,因此使用prometheus提供的reload的接口,进行服务重启
# 查看配置文件是否已经自动加载到pod中
$ kubectl -n monitor get po -o wide
prometheus-dcb499cbf-pljfn 1/1 Running 0 47h 10.244.1.167
$ kubectl -n monitor exec -ti prometheus-dcb499cbf-pljfn cat /etc/prometheus/prometheus.yml |grep alertmanager
# 使用软加载的方式,
$ curl -X POST 10.244.1.167:9090/-/reload
配置报警规则
目前Prometheus与Alertmanager已经连通,接下来我们可以针对收集到的各类指标配置报警规则,一旦满足报警规则的设置,则Prometheus将报警信息推送给Alertmanager,进而转发到我们配置的邮件中。
在哪里配置?同样是在prometheus-configmap中:
$ kuectl -n monitor edit configmap prometheus-config
apiVersion: v1
kind: ConfigMap
metadata:
  name: prometheus-config
  namespace: monitor
data:
  prometheus.yml: |
    global:
      scrape_interval: 30s
      evaluation_interval: 30s
    alerting:
      alertmanagers:
      - static_configs:
        - targets:
          - alertmanager:9093
    # Load rules once and periodically evaluate them according to the global  'evaluation_interval'.
    rule_files:
      - /etc/prometheus/alert_rules.yml
      # - "first_rules.yml"
      # - "second_rules.yml"
    scrape_configs:
    - job_name: 'prometheus'
      static_configs:
      - targets: ['localhost:9090']
...
rules.yml我们同样使用configmap的方式挂载到prometheus容器内部,因此只需要在已有的configmap中加一个数据项目
$ vim prometheus-configmap.yaml
apiVersion: v1
kind: ConfigMap
metadata:
  name: prometheus-config
  namespace: monitor
data:
  prometheus.yml: |
    global:
      scrape_interval: 15s
      evaluation_interval: 15s
    alerting:
      alertmanagers:
      - static_configs:
        - targets:
          - alertmanager:9093
    # Load rules once and periodically evaluate them according to the global  'evaluation_interval'.
    rule_files:
      - /etc/prometheus/alert_rules.yml
      # - "first_rules.yml"
      # - "second_rules.yml"
    scrape_configs:
    - job_name: 'prometheus'
      static_configs:
      - targets: ['localhost:9090']
... # 省略中间部分
  alert_rules.yml: |
    groups:
    - name: node_metrics
      rules:
      - alert: NodeLoad
        expr: node_load15 < 1
        for: 2m
        annotations:
          summary: "{{$labels.instance}}: Low node load detected"
          description: "{{$labels.instance}}: node load is below 1 (current value is: {{ $value }}"
告警规则的几个要素:
group.name:告警分组的名称,一个组下可以配置一类告警规则,比如都是物理节点相关的告警alert:告警规则的名称expr:是用于进行报警规则 PromQL 查询语句,expr通常是布尔表达式,可以让Prometheus根据计算的指标值做 true or false 的判断for:评估等待时间(Pending Duration),用于表示只有当触发条件持续一段时间后才发送告警,在等待期间新产生的告警状态为pending,屏蔽掉瞬时的问题,把焦点放在真正有持续影响的问题上labels:自定义标签,允许用户指定额外的标签列表,把它们附加在告警上,可以用于后面做路由判断,通知到不同的终端,通常被用于添加告警级别的标签annotations:指定了另一组标签,它们不被当做告警实例的身份标识,它们经常用于存储一些额外的信息,用于报警信息的展示之类的
规则配置中,支持模板的方式,其中:
- {{$labels}}可以获取当前指标的所有标签,支持{{$labels.instance}}或者{{$labels.job}}这种形式
- {{ $value }}可以获取当前计算出的指标值
更新配置并软重启,并查看Prometheus报警规则。
一个报警信息在生命周期内有下面3种状态:
inactive: 表示当前报警信息处于非活动状态,即不满足报警条件pending: 表示在设置的阈值时间范围内被激活了,即满足报警条件,但是还在观察期内firing: 表示超过设置的阈值时间被激活了,即满足报警条件,且报警触发时间超过了观察期,会发送到Alertmanager端
对于已经 pending 或者 firing 的告警,Prometheus 也会将它们存储到时间序列ALERTS{}中。当然我们也可以通过表达式去查询告警实例:
查看Alertmanager日志:
level=warn ts=2020-07-28T13:43:59.430Z caller=notify.go:674 component=dispatcher receiver=email integration=email[0] msg="Notify attempt failed, will retry later" attempts=1 err="*email.loginAuth auth: 550 User has no permission"
说明告警已经推送到Alertmanager端了,但是邮箱登录的时候报错,这是因为邮箱默认没有开启第三方客户端登录。因此需要登录163邮箱设置SMTP服务允许客户端登录。
自定义webhook实现告警消息的推送
目前官方内置的第三方通知集成包括:邮件、 即时通讯软件(如Slack、Hipchat)、移动应用消息推送(如Pushover)和自动化运维工具(例如:Pagerduty、Opsgenie、Victorops)。可以在alertmanager的管理界面中查看到。
每一个receiver具有一个全局唯一的名称,并且对应一个或者多个通知方式:
name: <string>
email_configs:
  [ - <email_config>, ... ]
hipchat_configs:
  [ - <hipchat_config>, ... ]
slack_configs:
  [ - <slack_config>, ... ]
opsgenie_configs:
  [ - <opsgenie_config>, ... ]
webhook_configs:
  [ - <webhook_config>, ... ]
如果想实现告警消息推送给企业常用的即时聊天工具,如钉钉或者企业微信,如何配置?
Alertmanager的通知方式中还可以支持Webhook,通过这种方式开发者可以实现更多个性化的扩展支持。
# 警报接收者
receivers:
#ops
- name: 'demo-webhook'
  webhook_configs:
  - send_resolved: true
    url: http://demo-webhook/alert/send
当我们配置了上述webhook地址,则当告警路由到alertmanager时,alertmanager端会向webhook地址推送POST请求:
$ curl -X POST -d"$demoAlerts"  http://demo-webhook/alert/send
$ echo $demoAlerts
{
  "version": "4",
  "groupKey": <string>, alerts (e.g. to deduplicate) ,
  "status": "<resolved|firing>",
  "receiver": <string>,
  "groupLabels": <object>,
  "commonLabels": <object>,
  "commonAnnotations": <object>,
  "externalURL": <string>, // backlink to the Alertmanager.
  "alerts":
   [{
     "labels": <object>,
      "annotations": <object>,
      "startsAt": "<rfc3339>",
      "endsAt": "<rfc3339>"
   }]
}
因此,假如我们想把报警消息自动推送到钉钉群聊,只需要:
- 实现一个webhook,部署到k8s集群
- 接收POST请求,将Alertmanager传过来的数据做解析,调用dingtalk的API,实现消息推送
- 配置alertmanager的receiver为webhook地址
如何给钉钉群聊发送消息? 钉钉机器人
钉钉群聊机器人设置:
每个群聊机器人在创建的时候都会生成唯一的一个访问地址:
https://oapi.dingtalk.com/robot/send?access_token=f628f749a7ad70e86ca7bcb68658d0ce5af7c201ce8ce32acaece4c592364ca9
这样,我们就可以使用如下方式来模拟给群聊机器人发送请求,实现消息的推送:
curl 'https://oapi.dingtalk.com/robot/send?access_token=f628f749a7ad70e86ca7bcb68658d0ce5af7c201ce8ce32acaece4c592364ca9' \
   -H 'Content-Type: application/json' \
   -d '{"msgtype": "text","text": {"content": "我就是我, 是不一样的烟火"}}'
https://gitee.com/agagin/prometheus-webhook-dingtalk
镜像地址:timonwong/prometheus-webhook-dingtalk:master
二进制运行:
假如使用如下配置:
targets:
  webhook_dev:
    url: https://oapi.dingtalk.com/robot/send?access_token=f33c539fa1012e0b3500f04ea98fb89468829ed324699d67ecd2f177a1dcc0c2
  webhook_ops:
    url: https://oapi.dingtalk.com/robot/send?access_token=4778abd23dbdbaf66fc6f413e6ab9c0103a039b0054201344a22a5692cdcc54e
则prometheus-webhook-dingtalk启动后会自动支持如下API的POST访问:
这样可以使用一个prometheus-webhook-dingtalk来实现多个钉钉群的webhook地址
部署prometheus-webhook-dingtalk,从Dockerfile可以得知需要注意的点:
- 默认使用配置文件
/etc/prometheus-webhook-dingtalk/config.yml,可以通过configmap挂载 - 该目录下还有模板文件,因此需要使用subpath的方式挂载
- 部署Service,作为Alertmanager的默认访问,服务端口默认8060
配置文件:
$ cat webhook-dingtalk-configmap.yaml
apiVersion: v1
data:
  config.yml: |
    targets:
      webhook_dev:
        url: https://oapi.dingtalk.com/robot/send?access_token=f33c539fa1012e0b3500f04ea98fb89468829ed324699d67ecd2f177a1dcc0c2
      webhook_ops:
        url: https://oapi.dingtalk.com/robot/send?access_token=4778abd23dbdbaf66fc6f413e6ab9c0103a039b0054201344a22a5692cdcc54e
kind: ConfigMap
metadata:
  name: webhook-dingtalk-config
  namespace: monitor
Deployment和Service
$ cat webhook-dingtalk-deploy.yaml
apiVersion: apps/v1
kind: Deployment
metadata:
  name: webhook-dingtalk
  namespace: monitor
spec:
  selector:
    matchLabels:
      app: webhook-dingtalk
  template:
    metadata:
      labels:
        app: webhook-dingtalk
    spec:
      containers:
      - name: webhook-dingtalk
        image: timonwong/prometheus-webhook-dingtalk:master
        args:
        - "--config.file=/etc/prometheus-webhook-dingtalk/config.yml"
        imagePullPolicy: IfNotPresent
        volumeMounts:
        - mountPath: "/etc/prometheus-webhook-dingtalk/config.yml"
          name: config
          subPath: config.yml
        ports:
        - containerPort: 8060
          name: http
        resources:
          requests:
            cpu: 50m
            memory: 100Mi
          limits:
            cpu: 50m
            memory: 100Mi
      volumes:
      - name: config
        configMap:
          name: webhook-dingtalk-config
          items:
          - key: config.yml
            path: config.yml
---
apiVersion: v1
kind: Service
metadata:
  name: webhook-dingtalk
  namespace: monitor
spec:
  selector:
    app: webhook-dingtalk
  ports:
  - name: hook
    port: 8060
    targetPort: http
创建:
$ kubectl apply -f webhook-dingtalk-configmap.yaml
$ kubectl apply -f webhook-dingtalk-deploy.yaml

# 查看日志,可以得知当前的可用webhook日志
$ kubectl -n monitor logs -f webhook-dingtalk-f7f5589c9-qglkd
...
file=/etc/prometheus-webhook-dingtalk/config.yml msg="Completed loading of configuration file"
level=info ts=2020-07-30T14:05:40.963Z caller=main.go:117 component=configuration msg="Loading templates" templates=
ts=2020-07-30T14:05:40.963Z caller=main.go:133 component=configuration msg="Webhook urls for prometheus alertmanager" urls="http://localhost:8060/dingtalk/webhook_dev/send http://localhost:8060/dingtalk/webhook_ops/send"
level=info ts=2020-07-30T14:05:40.963Z caller=web.go:210 component=web msg="Start listening for connections" address=:8060
修改Alertmanager路由及webhook配置:
$ kubectl -n monitor edit configmap alertmanager
apiVersion: v1
kind: ConfigMap
metadata:
  name: alertmanager
  namespace: monitor
data:
  config.yml: |-
    global:
      # 当alertmanager持续多长时间未接收到告警后标记告警状态为 resolved
      resolve_timeout: 5m
      # 配置邮件发送信息
      smtp_smarthost: 'smtp.163.com:25'
      smtp_from: 'earlene163@163.com'
      smtp_auth_username: 'earlene163@163.com'
      # 注意这里不是邮箱密码,是邮箱开启第三方客户端登录后的授权码
      smtp_auth_password: 'GXIWNXKMMEVMNHAJ'
      smtp_require_tls: false
    # 所有报警信息进入后的根路由,用来设置报警的分发策略
    route:
      # 按照告警名称分组
      group_by: ['alertname']
      # 当一个新的报警分组被创建后,需要等待至少 group_wait 时间来初始化通知,这种方式可以确保您能有足够的时间为同一分组来获取多个警报,然后一起触发这个报警信息。
      group_wait: 30s

      # 相同的group之间发送告警通知的时间间隔
      group_interval: 30s

      # 如果一个报警信息已经发送成功了,等待 repeat_interval 时间来重新发送他们,不同类型告警发送频率需要具体配置
      repeat_interval: 1m

      # 默认的receiver:如果一个报警没有被一个route匹配,则发送给默认的接收器
      receiver: default

      # 路由树,默认继承global中的配置,并且可以在每个子路由上进行覆盖。
      routes:
      - {}
    receivers:
    - name: 'default'
      email_configs:
      - to: '654147123@qq.com'
        send_resolved: true  # 接受告警恢复的通知
      webhook_configs:
      - send_resolved: true
        url: http://webhook-dingtalk:8060/dingtalk/webhook_dev/send
验证钉钉消息是否正常收到。
动态告警配置
基于Label的动态告警处理
真实的场景中,我们往往期望可以给告警设置级别,而且可以实现不同的报警级别可以由不同的receiver接收告警消息。
Alertmanager中路由负责对告警信息进行分组匹配,并向告警接收器发送通知。告警接收器可以通过以下形式进行配置:
routes:
- receiver: ops
  group_wait: 10s
  match:
    severity: critical
- receiver: dev
  group_wait: 10s
  match_re:
    severity: normal|middle
receivers:
  - ops
    ...
  - dev
    ...
  - <receiver> ...
因此可以为了更全面的感受报警的逻辑,我们再添加两个报警规则:
  alert_rules.yml: |
    groups:
    - name: node_metrics
      rules:
      - alert: NodeLoad
        expr: node_load15 < 1
        for: 2m
        labels:
          severity: normal
        annotations:
          summary: "{{$labels.instance}}: Low node load detected"
          description: "{{$labels.instance}}: node load is below 1 (current value is: {{ $value }}"
      - alert: NodeMemoryUsage
        expr: (node_memory_MemTotal_bytes - (node_memory_MemFree_bytes + node_memory_Buffers_bytes + node_memory_Cached_bytes)) / node_memory_MemTotal_bytes * 100 > 30
        for: 2m
        labels:
          severity: critical
        annotations:
          summary: "{{$labels.instance}}: High Memory usage detected"
          description: "{{$labels.instance}}: Memory usage is above 40% (current value is: {{ $value }}"
    - name: targets_status
      rules:
      - alert: TargetStatus
        expr: up == 0
        for: 1m
        labels:
          severity: critical
        annotations:
          summary: "{{$labels.instance}}: prometheus target down"
          description: "{{$labels.instance}}: prometheus target down,job is {{$labels.job}}"
我们为不同的报警规则设置了不同的标签,如severity: critical,针对规则中的label,来配置alertmanager路由规则,实现转发给不同的接收者。
$ cat alertmanager-configmap.yaml
apiVersion: v1
kind: ConfigMap
metadata:
  name: alertmanager
  namespace: monitor
data:
  config.yml: |-
    global:
      # 当alertmanager持续多长时间未接收到告警后标记告警状态为 resolved
      resolve_timeout: 5m
      # 配置邮件发送信息
      smtp_smarthost: 'smtp.163.com:25'
      smtp_from: 'earlene163@163.com'
      smtp_auth_username: 'earlene163@163.com'
      # 注意这里不是邮箱密码,是邮箱开启第三方客户端登录后的授权码
      smtp_auth_password: 'RMAOPQVHKLPYFVHZ'
      smtp_require_tls: false
    # 所有报警信息进入后的根路由,用来设置报警的分发策略
    route:
      # 按照告警名称分组
      group_by: ['alertname']
      # 当一个新的报警分组被创建后,需要等待至少 group_wait 时间来初始化通知,这种方式可以确保您能有足够的时间为同一分组来获取多个警报,然后一起触发这个报警信息。
      group_wait: 30s

      # 相同的group之间发送告警通知的时间间隔
      group_interval: 30s

      # 如果一个报警信息已经发送成功了,等待 repeat_interval 时间来重新发送他们,不同类型告警发送频率需要具体配置
      repeat_interval: 1m

      # 默认的receiver:如果一个报警没有被一个route匹配,则发送给默认的接收器
      receiver: default

      # 路由树,默认继承global中的配置,并且可以在每个子路由上进行覆盖。
      routes:
      - receiver: critical_alerts
        group_wait: 10s
        match:
          severity: critical
      - receiver: normal_alerts
        group_wait: 10s
        match_re:
          severity: normal|middle
    receivers:
    - name: 'default'
      email_configs:
      - to: '654147123@qq.com'
        send_resolved: true  # 接受告警恢复的通知
    - name: 'critical_alerts'
      webhook_configs:
      - send_resolved: true
        url: http://webhook-dingtalk:8060/dingtalk/webhook_ops/send
    - name: 'normal_alerts'
      webhook_configs:
      - send_resolved: true
        url: http://webhook-dingtalk:8060/dingtalk/webhook_dev/send
再配置一个钉钉机器人,修改webhook-dingtalk的配置,添加webhook_ops的配置:
$ cat webhook-dingtalk-configmap.yaml
apiVersion: v1
data:
  config.yml: |
    targets:
      webhook_dev:
        url: https://oapi.dingtalk.com/robot/send?access_token=f628f749a7ad70e86ca7bcb68658d0ce5af7c201ce8ce32acaece4c592364ca9
      webhook_ops:
        url: https://oapi.dingtalk.com/robot/send?access_token=5a68888fbecde75b1832ff024d7374e51f2babd33f1078e5311cdbb8e2c00c3a
kind: ConfigMap
metadata:
  name: webhook-dingtalk-config
  namespace: monitor
分别更新Prometheus和Alertmanager配置,查看报警的发送。
抑制和静默
前面我们知道,告警的group(分组)功能通过把多条告警数据聚合,有效的减少告警的频繁发送。除此之外,Alertmanager还支持Inhibition(抑制) 和 Silences(静默),帮助我们抑制或者屏蔽报警。
- Inhibition 抑制
抑制是当出现其它告警的时候压制当前告警的通知,可以有效的防止告警风暴。
比如当机房出现网络故障时,所有服务都将不可用而产生大量服务不可用告警,但这些警告并不能反映真实问题在哪,真正需要发出的应该是网络故障告警。当出现网络故障告警的时候,应当抑制服务不可用告警的通知。
在Alertmanager配置文件中,使用inhibit_rules定义一组告警的抑制规则:
每一条抑制规则的具体配置如下:
target_match:
  [ <labelname>: <labelvalue>, ... ]
target_match_re:
  [ <labelname>: <regex>, ... ]

source_match:
  [ <labelname>: <labelvalue>, ... ]
source_match_re:
  [ <labelname>: <regex>, ... ]

[ equal: '[' <labelname>, ... ']' ]
当已经发送的告警通知匹配到target_match或者target_match_re规则,当有新的告警规则如果满足source_match或者定义的匹配规则,并且已发送的告警与新产生的告警中equal定义的标签完全相同,则启动抑制机制,新的告警不会发送。
例如,定义如下抑制规则:
- source_match:
    alertname: NodeDown
    severity: critical
  target_match:
    severity: critical
  equal:
    - node
如当集群中的某一个主机节点异常宕机导致告警NodeDown被触发,同时在告警规则中定义了告警级别severity=critical。由于主机异常宕机,该主机上部署的所有服务,中间件会不可用并触发报警。根据抑制规则的定义,如果有新的告警级别为severity=critical,并且告警中标签node的值与NodeDown告警的相同,则说明新的告警是由NodeDown导致的,则启动抑制机制停止向接收器发送通知。
演示:实现如果 NodeMemoryUsage 报警触发,则抑制NodeLoad指标规则引起的报警。
    inhibit_rules:
    - source_match:
        alertname: NodeMemoryUsage
        severity: critical
      target_match:
        severity: normal;
      equal:
        - instance
- Silences: 静默
简单直接的在指定时段关闭告警。静默通过匹配器(Matcher)来配置,类似于路由树。警告进入系统的时候会检查它是否匹配某条静默规则,如果是则该警告的通知将忽略。 静默规则在Alertmanager的 Web 界面里配置。
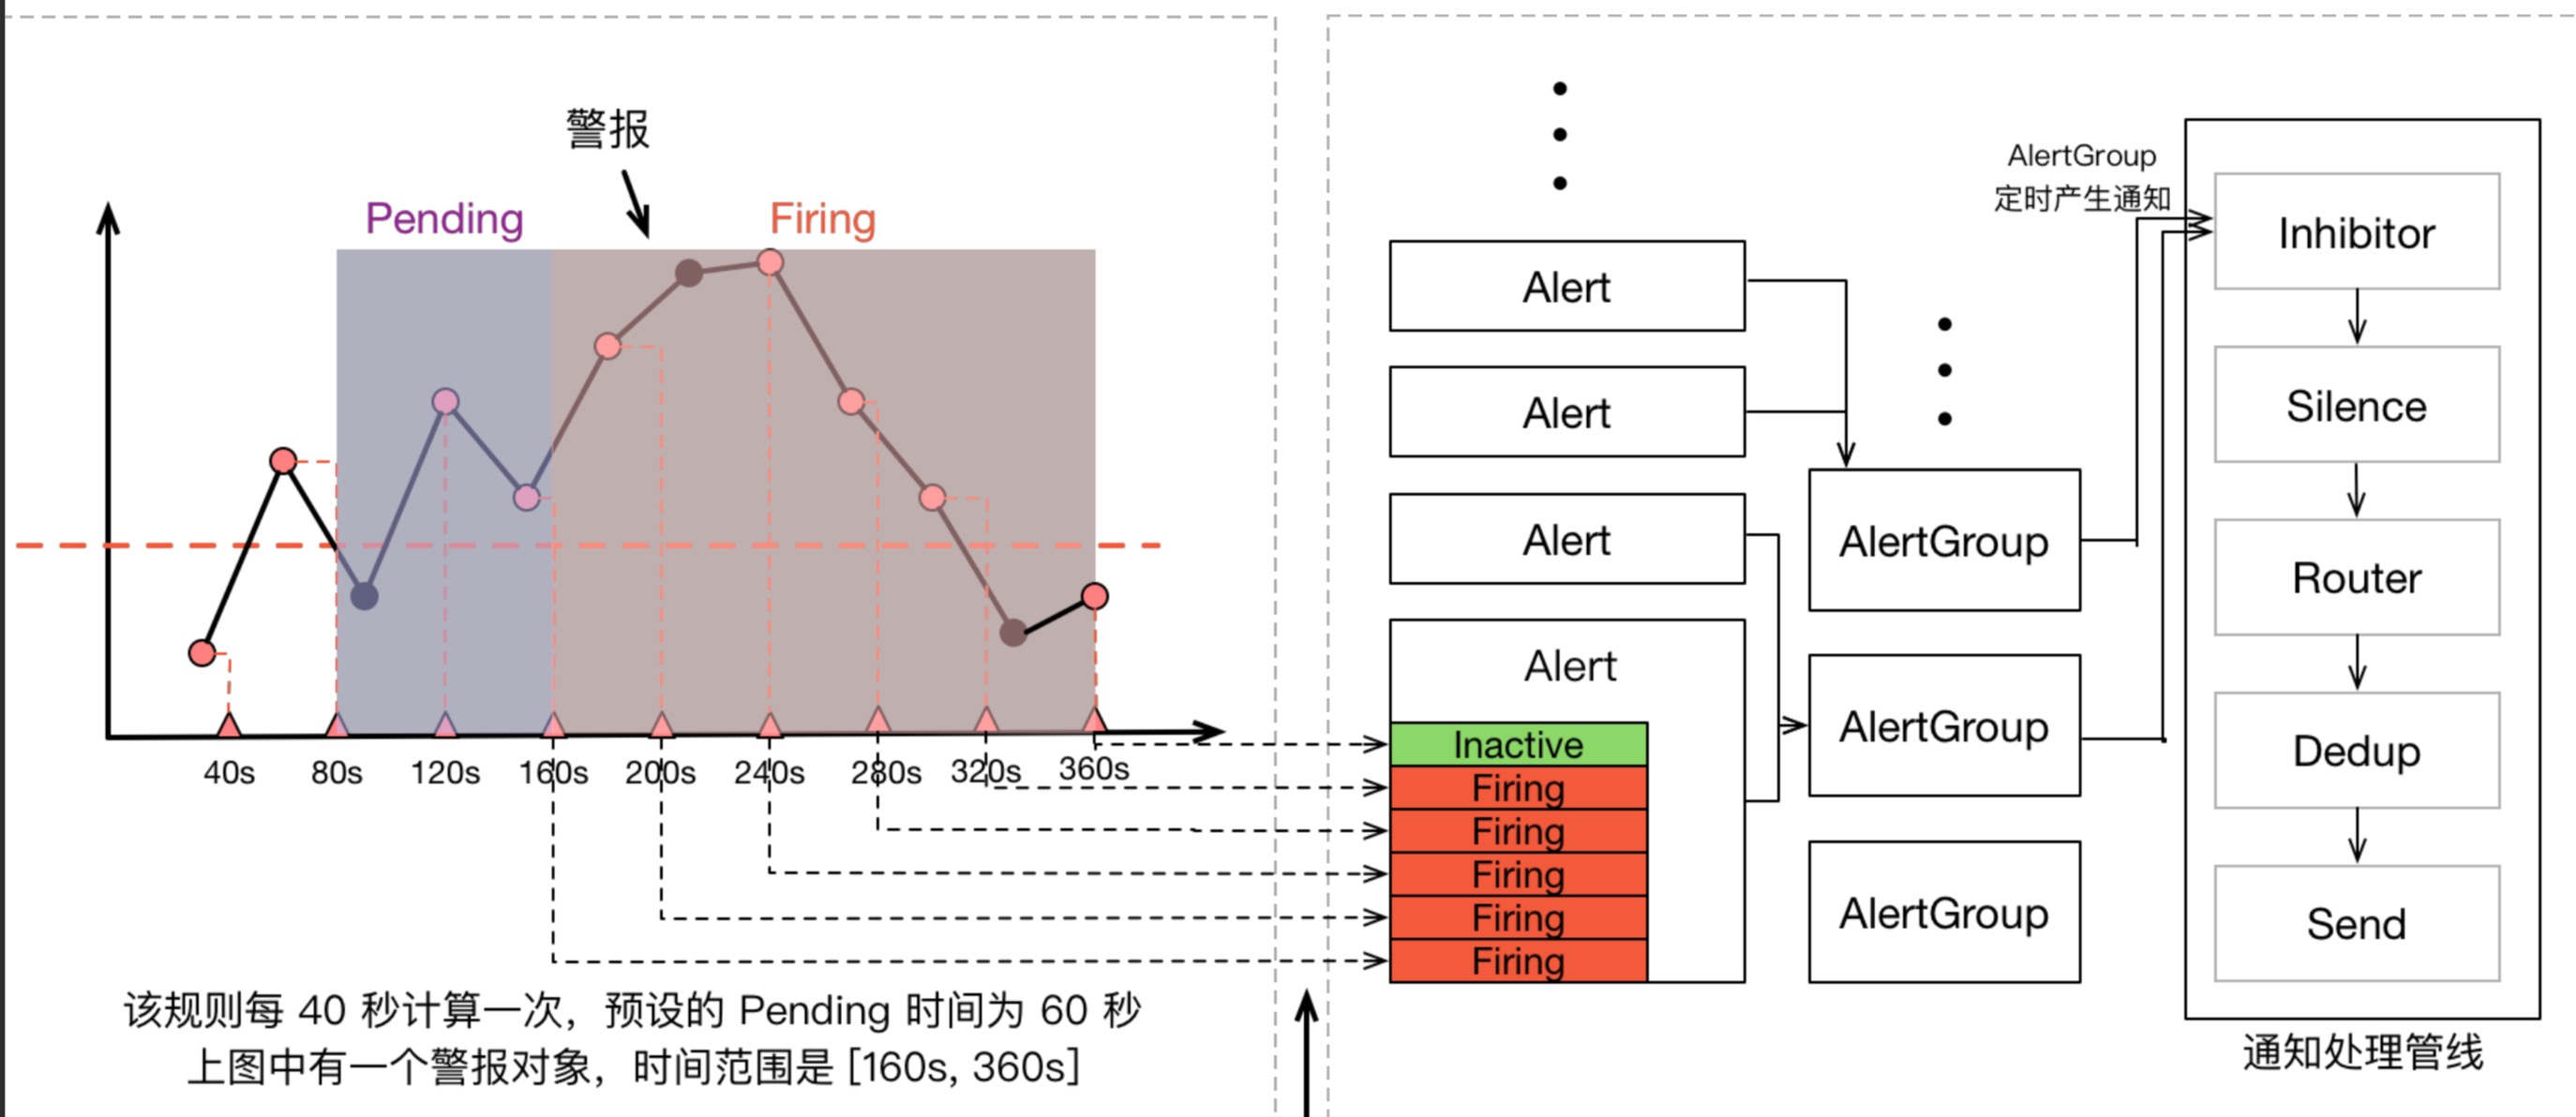
一条告警产生后,还要经过 Alertmanager 的分组、抑制处理、静默处理、去重处理和降噪处理最后再发送给接收者。这个过程中可能会因为各种原因会导致告警产生了却最终没有进行通知,可以通过下图了解整个告警的生命周期:
k8s-prometheus-adaptor安装配置
自定义指标实现业务伸缩
Kubernetes Metrics API体系回顾
前面章节,我们讲过基于CPU和内存的HPA,即利用metrics-server及HPA,可以实现业务服务可以根据pod的cpu和内存进行弹性伸缩。
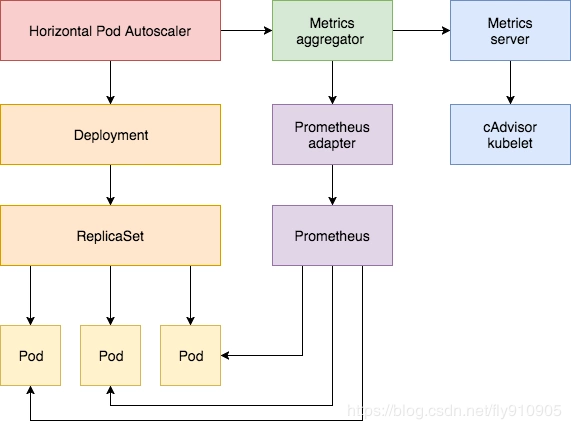
k8s对监控接口进行了标准化:
- Resource Metrics
对应的接口是 metrics.k8s.io,主要的实现就是 metrics-server
- Custom Metrics
对应的接口是 custom.metrics.k8s.io,主要的实现是 Prometheus, 它提供的是资源监控和自定义监控
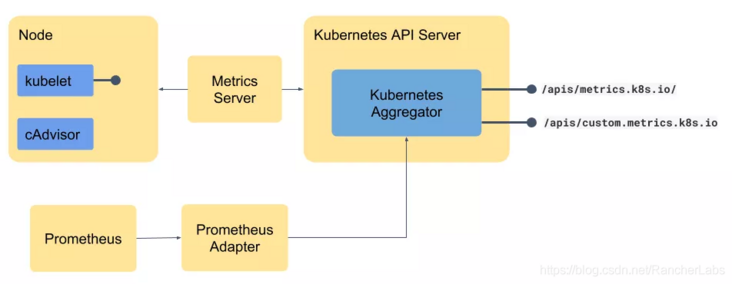
安装完metrics-server后,利用kube-aggregator的功能,实现了metrics api的注册。可以通过如下命令
HPA通过使用该API获取监控的CPU和内存资源:
# 查询nodes节点的cpu和内存数据
$ kubectl get --raw="/apis/metrics.k8s.io/v1beta1/nodes"|jq

$ kubectl get --raw="/apis/metrics.k8s.io/v1beta1/pods"|jq

# 若本机没有安装jq命令,可以参考如下方式进行安装
$ wget http://dl.fedoraproject.org/pub/epel/epel-release-latest-7.noarch.rpm
$ rpm -ivh epel-release-latest-7.noarch.rpm
$ yum install -y jq
同样,为了实现通用指标的采集,需要部署Prometheus Adapter,来提供custom.metrics.k8s.io,作为HPA获取通用指标的入口。
Adapter安装对接
项目地址为: https://github.com/DirectXMan12/k8s-prometheus-adapter
查看部署说明 https://github.com/DirectXMan12/k8s-prometheus-adapter/tree/v0.8.4/deploy
-
镜像使用官方提供的v0.8.4最新版 https://hub.docker.com/r/directxman12/k8s-prometheus-adapter/tags
-
准备证书
$ export PURPOSE=serving
$ openssl req -x509 -sha256 -new -nodes -days 3650 -newkey rsa:2048 -keyout ${PURPOSE}.key -out ${PURPOSE}.crt -subj "/CN=ca"

$ kubectl -n monitor create secret generic cm-adapter-serving-certs --from-file=./serving.crt --from-file=./serving.key

# 查看证书
$ kubectl -n monitor describe secret cm-adapter-serving-certs
- 替换命名空间
# 资源清单文件默认用的命名空间是custom-metrics,替换为本例中使用的monitor
$ sed -i 's/namespace: custom-metrics/namespace: monitor/g' manifests/*
- 配置adapter对接的Prometheus地址
# 由于adapter会和Prometheus交互,因此需要配置对接的Prometheus地址
# 替换掉28行:yamls/custom-metrics-apiserver-deployment.yaml 中的--prometheus-url
$ vim manifests/custom-metrics-apiserver-deployment.yaml
...
     18     spec:
     19       serviceAccountName: custom-metrics-apiserver
     20       containers:
     21       - name: custom-metrics-apiserver
     22         image: directxman12/k8s-prometheus-adapter-amd64:v0.7.0
     23         args:
     24         - --secure-port=6443
     25         - --tls-cert-file=/var/run/serving-cert/serving.crt
     26         - --tls-private-key-file=/var/run/serving-cert/serving.key
     27         - --logtostderr=true
     28         - --prometheus-url=http://prometheus:9090/
     29         - --metrics-relist-interval=1m
     30         - --v=10
     31         - --config=/etc/adapter/config.yaml
...
- 部署服务
$ mv manifests/custom-metrics-config-map.yaml .
$ vi manifests/custom-metrics-configmap.yaml
apiVersion: v1
kind: ConfigMap
metadata:
  name: adapter-config
  namespace: monitor
data:
  config.yaml: |
    rules:
    - {}
$ kubectl apply -f manifests/
验证一下:
$ kubectl api-versions|grep metrics
custom.metrics.k8s.io/v1beta1
custom.metrics.k8s.io/v1beta2
external.metrics.k8s.io/v1beta1
metrics.k8s.io/v1beta1

$ kubectl get --raw /apis/custom.metrics.k8s.io/v1beta2 |jq
{
  "kind": "APIResourceList",
  "apiVersion": "v1",
  "groupVersion": "custom.metrics.k8s.io/v1beta2",
  "resources": []
}
配置自定义指标
通用指标示例程序部署
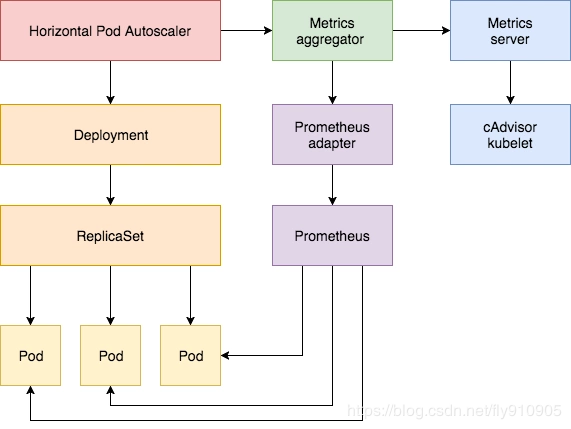
为了演示效果,我们新建一个deployment来模拟业务应用。
$ cat custom-metrics-demo.yaml
apiVersion: apps/v1
kind: Deployment
metadata:
  name: custom-metrics-demo
spec:
  replicas: 1
  selector:
    matchLabels:
      app: custom-metrics-demo
  template:
    metadata:
      labels:
        app: custom-metrics-demo
    spec:
      containers:
      - name: custom-metrics-demo
        image: luxas/autoscale-demo:v0.1.2
        resources:
          limits:
            cpu: 50m
          requests:
            cpu: 50m
部署:
$ kubectl apply -f custom-metrics-demo.yaml

$ kubectl get po -o wide
custom-metrics-demo-95b5bc949-xpppl   1/1     Running   0          65s   10.244.1.194

$ curl 10.244.1.194:8080/metrics
# HELP http_requests_total The amount of requests served by the server in total
# TYPE http_requests_total counter
http_requests_total 2
注册为Prometheus的target:
$ cat custom-metrics-demo-svc.yaml
apiVersion: v1
kind: Service
metadata:
  name: custom-metrics-demo
  annotations:
    prometheus.io/scrape: "true"
    prometheus.io/port: "8080"
spec:
  ports:
  - port: 80
    targetPort: 8080
    name: http
  selector:
    app: custom-metrics-demo
  type: ClusterIP
自动注册为Prometheus的采集Targets。
通常web类的应用,会把每秒钟的请求数作为业务伸缩的指标依据。
实践:
使用案例应用custom-metrics-demo,如果custom-metrics-demo最近1分钟内每秒钟的请求数超过10次,则自动扩充业务应用的副本数。
- 配置自定义指标
告诉Adapter去采集转换哪些指标,Adapter支持转换的指标,才可以作为HPA的依据
- 配置HPA规则
apiVersion: autoscaling/v2beta1
kind: HorizontalPodAutoscaler
metadata:
  name: front-app-hpa
  namespace: default
spec:
  scaleTargetRef:
    apiVersion: apps/v1
    kind: Deployment
    name: custom-metrics-demo
  minReplicas: 1
  maxReplicas: 3
  metrics:
  - type: Pods
    pods:
      metricName: http_requests_per_second
      targetAverageValue: 10
Adapter配置自定义指标
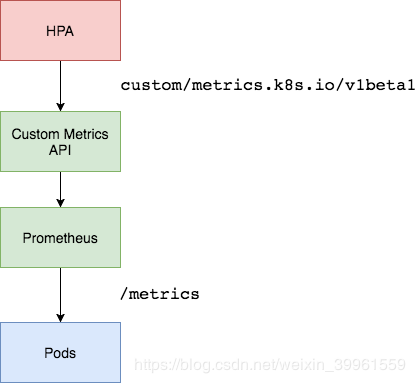
思考:
前面讲CPU的平均使用率的采集,其实是通过node_cpu_seconds_total指标计算得到的。
  ^
  │   . . . . . . . . . . . . . . . . .   . .   node_cpu{cpu="cpu0",mode="idle"}
  │     . . . . . . . . . . . . . . . . . . .   node_cpu{cpu="cpu0",mode="system"}
  │     . . . . . . . . . .   . . . . . . . .   node_load1{}
  │     . . . . . . . . . . . . . . . .   . .   node_cpu_seconds_total{...}
  v
    <------------------ 时间 ---------------->
同样,如果想获得每个业务应用最近1分钟内每秒的访问次数,也是根据总数来做计算,因此,需要使用业务自定义指标http_requests_total,配合rate方法即可获取每秒钟的请求数。
rate(http_requests_total[2m])

# 如查询有多条数据,需做汇聚,需要使用sum
sum(rate(http_requests_total[2m])) by(kubernetes_pod_name)
- 自定义指标可以配置多个,因此,需要将规则使用数组来配置
- 告诉Adapter,哪些自定义指标可以使用
seriesQuery是PromQL语句,和直接用http_requests_total查询到的结果一样,凡是seriesQuery可以查询到的指标,都可以用作自定义指标
- 告诉Adapter,指标中的标签和k8s中的资源对象的关联关系
rules:
- seriesQuery: 'http_requests_total{}'
resources:
overrides:
kubernetes_namespace: {resource: "namespace"}
kubernetes_pod_name: {resource: "pod"}
hpa 拿着k8s里的namepace和pod名称,来查询adaptor,adaptor去查询Prometheus的时候根据resources的适配来转换,namepace=default, pod=front-app-xxxx, kubernetes_namespace="default"
我们查询到的可用指标格式为:
http_requests_total{instance="10.244.2.140:8080", job="kubernetes-sd-endpoints", kubernetes_name="custom-metrics-demo", kubernetes_namespace="default", kubernetes_pod_name="front-app-df5fc79dd-rmzr6", namespace="default", pod="front-app-df5fc79dd-rmzr6"}
由于HPA在调用Adapter接口的时候,告诉Adapter的是查询哪个命名空间下的哪个Pod的指标,因此,Adapter在去查询的时候,需要做一层适配转换(因为并不是每个prometheus查询到的结果中都是叫做kubernetes_namespace和kubernetes_pod_name)
/apis/custom.metrics.k8s.io/v1beta2/namespaces/default/pods/xxx/http_requests_total
- 指定自定义的指标名称,供HPA配置使用
rules:
- seriesQuery: 'http_requests_total{}'
  resources:
    overrides:
      kubernetes_namespace: {resource: "namespace"}
      kubernetes_pod_name: {resource: "pod"}
name:
as: "http_requests_per_second"
因为Adapter转换完之后的指标含义为:每秒钟的请求数。因此提供指标名称,该配置根据正则表达式做了匹配替换,转换完后的指标名称为:http_requests_per_second,HPA规则中可以直接配置该名称。
- 告诉Adapter如何获取最终的自定义指标值
rules:
- seriesQuery: 'http_requests_total{}'
  resources:
    overrides:
      kubernetes_namespace: {resource: "namespace"}
      kubernetes_pod_name: {resource: "pod"}
  name:
    as: "http_requests_per_second"
metricsQuery: 'sum(rate(<<.Series>>{<<.LabelMatchers>>}[2m])) by (<<.GroupBy>>)'
我们最终期望的写法可能是这样:
sum(rate(http_requests_total{kubernetes_namespace="default",kubernetes_pod_name="xxxx"}[2m])) by (kubernetes_pod_name)
但是Adapter提供了更简单的写法:
Series
- 指标名称
LabelMatchers: 指标查询的labelGroupBy: 结果分组,针对HPA过来的查询,都会匹配成kubernetes_pod_name
更新Adapter的配置:
$ vi custom-metrics-configmap.yaml
apiVersion: v1
kind: ConfigMap
metadata:
  name: adapter-config
  namespace: monitor
data:
  config.yaml: |
    rules:
    - seriesQuery: 'http_requests_total'
      seriesFilters: []
      resources:
        overrides:
          kubernetes_namespace: {resource: "namespace"}
          kubernetes_pod_name: {resource: "pod"}
      name:
        as: "http_requests_per_second"
      metricsQuery: (sum(rate(<<.Series>>{<<.LabelMatchers>>}[1m])) by (<<.GroupBy>>))
需要更新configmap并重启adapter服务:
$ kubectl apply -f custom-metrics-configmap.yaml

$ kubectl -n monitor delete po custom-metrics-apiserver-c689ff947-zp8gq
再次查看可用的指标数据:
$ kubectl get --raw /apis/custom.metrics.k8s.io/v1beta1 |jq
{
  "kind": "APIResourceList",
  "apiVersion": "v1",
  "groupVersion": "custom.metrics.k8s.io/v1beta2",
  "resources": [
    {
      "name": "namespaces/http_requests_per_second",
      "singularName": "",
      "namespaced": false,
      "kind": "MetricValueList",
      "verbs": [
        "get"
      ]
    },
    {
      "name": "pods/http_requests_per_second",
      "singularName": "",
      "namespaced": true,
      "kind": "MetricValueList",
      "verbs": [
        "get"
      ]
    }
  ]
}
实际中,hpa会去对如下地址发起请求,获取数据:
$ kubectl get --raw /apis/custom.metrics.k8s.io/v1beta2/namespaces/default/pods/*/http_requests_per_second |jq
{
  "kind": "MetricValueList",
  "apiVersion": "custom.metrics.k8s.io/v1beta2",
  "metadata": {
    "selfLink": "/apis/custom.metrics.k8s.io/v1beta2/namespaces/default/pods/%2A/http_requests_per_second"
  },
  "items": [
    {
      "describedObject": {
        "kind": "Pod",
        "namespace": "default",
        "name": "front-app-df5fc79dd-rmzr6",
        "apiVersion": "/v1"
      },
      "metric": {
        "name": "http_requests_per_second",
        "selector": null
      },
      "timestamp": "2021-07-02T09:24:12Z",
      "value": "33m"
    }
  ]
}
其中33m等于0.033,即当前指标查询每秒钟请求数为0.033次.
我们发现有两个可用的resources,引用官方的一段解释:
Notice that we get an entry for both "pods" and "namespaces" -- the adapter exposes the metric on each resource that we've associated the metric with (and all namespaced resources must be associated with a namespace), and will fill in the <<.GroupBy>> section with the appropriate label depending on which we ask for.

We can now connect to $KUBERNETES/apis/custom.metrics.k8s.io/v1beta1/namespaces/default/pods/*/nginx_vts_server_requests_per_second, and we should see
https://github.com/DirectXMan12/k8s-prometheus-adapter/blob/master/docs/config-walkthrough.md
https://github.com/DirectXMan12/k8s-prometheus-adapter/blob/master/docs/config.md
配置HPA实现自定义指标的业务伸缩
$ cat hpa-custom-metrics.yaml
apiVersion: autoscaling/v2beta1
kind: HorizontalPodAutoscaler
metadata:
  name: custom-metrics-demo
  namespace: default
spec:
  scaleTargetRef:
    apiVersion: apps/v1
    kind: Deployment
    name: custom-metrics-demo
  minReplicas: 1
  maxReplicas: 3
  metrics:
  - type: Pods
    pods:
      metricName: http_requests_per_second
      targetAverageValue: 10

$ kubectl apply -f hpa-custom-metrics.yaml

$ kubectl get hpa
注意metricName为自定义的指标名称。
使用ab命令压测front-app服务,观察hpa的变化:
$ kubectl get svc -o wide
custom-metrics-demo   ClusterIP   10.104.110.245   <none>        80/TCP    16h

$ ab -n1000 -c 5 http://10.104.110.245:80/
观察hpa变化:
查看adapter日志:
$ kubectl -n monitor logs --tail=100 -f custom-metrics-apiserver-c689ff947-m5vlr
...
I0802 04:43:58.404559       1 httplog.go:90] GET /apis/custom.metrics.k8s.io/v1beta1/namespaces/default/pods/%2A/nginx_vts_server_requests_per_second?labelSelector=app%3Dcustom-metrics-demo: (20.713209ms) 200 [kube-controller-manager/v1.16.0 (linux/amd64) kubernetes/2bd9643/system:serviceaccount:kube-system:horizontal-pod-autoscaler 172.21.51.143:60626]
实际的请求:
http://prometheus:9090/api/v1/query?query=%28sum%28rate%28nginx_vts_server_requests_per_second%7Bkubernetes_namespace%3D%22default%22%2Ckubernetes_pod_name%3D~%22custom-metrics-demo-95b5bc949-9vd8q%7Ccustom-metrics-demo-95b5bc949-qrpnp%22%2Cjob%3D%22kubernetes-sd-endpoints%22%7D%5B1m%5D%29%29+by+%28kubernetes_pod_name

I1028 08:56:05.289421       1 api.go:74] GET http://prometheus:9090/api/v1/query?query=%28sum%28rate%28nginx_vts_server_requests_total%7Bkubernetes_namespace%3D%22default%22%2Ckubernetes_pod_name%3D~%22custom-metrics-demo-95b5bc949-9vd8q%7Ccustom-metrics-demo-95b5bc949-qrpnp%22%7D%5B1m%5D%29%29+by+%28kubernetes_pod_name%29%29&time=1603875365.284 200 OK
补充:coredns通用指标的hpa
coredns_dns_requests_total指标记录了coredns域名解析记录的信息,我们想根据coredns被访问的频率来实现动态伸缩coredns服务的副本数,因此,基于上述知识,可以添加如下内容:
$ cat custom-metrics-configmap.yaml
apiVersion: v1
kind: ConfigMap
metadata:
  name: adapter-config
  namespace: monitor
data:
  config.yaml: |
    rules:
    - seriesQuery: 'http_requests_total'
      seriesFilters: []
      resources:
        overrides:
          kubernetes_namespace: {resource: "namespace"}
          kubernetes_pod_name: {resource: "pod"}
      name:
        as: "http_requests_per_second"
      metricsQuery: (sum(rate(<<.Series>>{<<.LabelMatchers>>}[1m])) by (<<.GroupBy>>))
    - seriesQuery: 'coredns_dns_requests_total{}'
      seriesFilters: []
      resources:
        overrides:
          kubernetes_namespace: {resource: "namespace"}
          kubernetes_pod_name: {resource: "pod"}
      name:
        as: "coredns_dns_request_count_per_second"
      metricsQuery: (sum(rate(<<.Series>>{<<.LabelMatchers>>}[1m])) by (<<.GroupBy>>))
coredns的hpa文件:
$ cat coredns-hpa.yaml
apiVersion: autoscaling/v2beta1
kind: HorizontalPodAutoscaler
metadata:
  name: coredns-hpa
  namespace: kube-system
spec:
  scaleTargetRef:
    apiVersion: apps/v1
    kind: Deployment
    name: coredns
  minReplicas: 2
  maxReplicas: 10
  metrics:
  - type: Pods
    pods:
      metricName: coredns_dns_request_count_per_second
      targetAverageValue: 1000
可以通过正则匹配的方式,实现对于同一类别的业务指标的定义:
$ cat custom-metrics-configmap.yaml
apiVersion: v1
kind: ConfigMap
metadata:
  name: adapter-config
  namespace: monitor
data:
  config.yaml: |
    rules:
    - seriesQuery: '{__name__=~".*_requests_total",kubernetes_pod_name!="",kubernetes_namespace!=""}'
      seriesFilters: []
      resources:
        overrides:
          kubernetes_namespace:
            resource: namespace
          kubernetes_pod_name:
            resource: pod
      name:
        matches: ^(.*)_total$
        as: "${1}_per_second"
      metricsQuery: sum(rate(<<.Series>>{<<.LabelMatchers>>}[1m])) by (<<.GroupBy>>)
coredns_dns_requests_per_second
http_requests__per_second
再次查看当前可用的自定义指标: