日志采集架构
k8s日志收集架构
https://kubernetes.io/docs/concepts/cluster-administration/logging/
容器日志的存储
- Docker容器的日志
容器日志驱动:
https://docs.docker.com/config/containers/logging/configure/
查看当前的docker主机的驱动:
json-file格式,docker会默认将标准和错误输出保存为宿主机的文件,路径为:
/var/lib/docker/containers/<container-id>/<container-id>-json.log
并且可以设置日志轮转:
{
  "log-driver": "json-file",
  "log-opts": {
    "max-size": "10m",
    "max-file": "3",
    "labels": "production_status",
    "env": "os,customer"
  }
}
- k8s Pod的日志存储
总体分为三种方式:
- 使用在每个节点上运行的节点级日志记录代理。
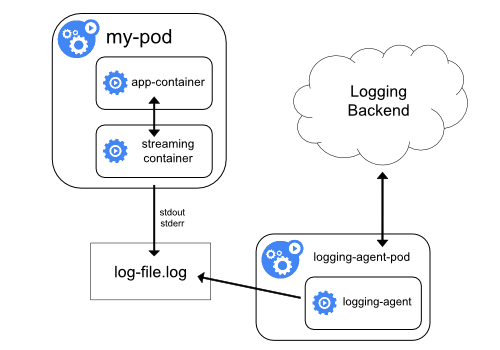
- 在应用程序的 pod 中,包含专门记录日志的 sidecar 容器。
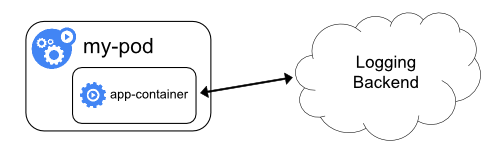
- 将日志直接从应用程序中推送到日志记录后端。
[使用节点级日志代理]
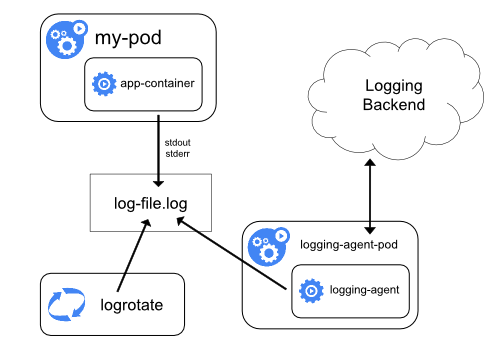
优势:
- 部署方便,使用DaemonSet类型控制器来部署agent即可
- 对业务应用的影响最小,没有侵入性
劣势:
- 只能收集标准和错误输出,对于容器内的文件日志,暂时收集不到
使用 sidecar 容器和日志代理
思路:在pod中启动一个sidecar容器,把容器内的日志文件吐到标准输出,由宿主机中的日志收集agent进行采集。
cat <<\EOF count-pod.yaml
apiVersion: v1
kind: Pod
metadata:
  name: counter
spec:
  containers:
  - name: count
    image: busybox
    args:
    - /bin/sh
    - -c
    - >
      i=0;
      while true;
      do
        echo "$i: $(date)" >> /var/log/1.log;
        echo "$(date) INFO $i" >> /var/log/2.log;
        i=$((i+1));
        sleep 1;
      done
    volumeMounts:
    - name: varlog
      mountPath: /var/log
  - name: count-log-1
    image: busybox
    args: [/bin/sh, -c, 'tail -n+1 -f /var/log/1.log']
    volumeMounts:
    - name: varlog
      mountPath: /var/log
  - name: count-log-2
    image: busybox
    args: [/bin/sh, -c, 'tail -n+1 -f /var/log/2.log']
    volumeMounts:
    - name: varlog
      mountPath: /var/log
  volumes:
  - name: varlog
    emptyDir: {}
EOF

kubectl apply -f counter-pod.yaml
kubectl logs -f counter -c count-log-1
优势:
- 可以实现容器内部日志收集
- 对业务应用的侵入性不大
劣势:
- 每个业务pod都需要做一次改造
-
增加了一次日志的写入,对磁盘使用率有一定影响
-
方式二:sidecar 容器运行一个日志代理,配置该日志代理以便从应用容器收集日志。
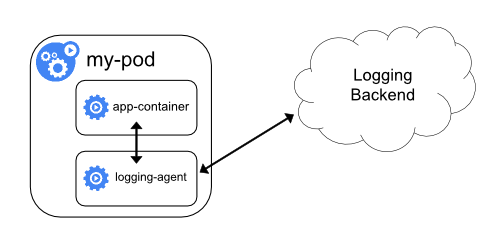
思路:直接在业务Pod中使用sidecar的方式启动一个日志收集的组件(比如fluentd),这样日志收集可以将容器内的日志当成本地文件来进行收取。
优势:不用往宿主机存储日志,本地日志完全可以收集
劣势:每个业务应用额外启动一个日志agent,带来额外的资源损耗
从应用中直接暴露日志目录
企业日志方案选型
目前来讲,最建议的是采用节点级的日志代理。
方案一:自研方案,实现一个自研的日志收集agent,大致思路:
- 针对容器的标准输出及错误输出,使用常规的方式,监听宿主机中的容器输出路径即可
- 针对容器内部的日志文件
- 在容器内配置统一的环境变量,比如LOG_COLLECT_FILES,指定好容器内待收集的日志目录及文件
- agent启动的时候挂载docker.sock文件及磁盘的根路径
- 监听docker的容器新建、删除事件,通过docker的api,查出容器的存储、环境变量、k8s属性等信息
- 配置了LOG_COLLECT_FILES环境变量的容器,根据env中的日志路径找到主机中对应的文件路径,然后生成收集的配置文件
- agent与开源日志收集工具(Fluentd或者filebeat等)配合,agent负责下发配置到收集工具中并对进程做reload
fluentd-pilot
方案二:日志使用开源的Agent进行收集(EFK方案),适用范围广,可以满足绝大多数日志收集、展示的需求。
fluentd概念及工作流程
EFK架构工作流程
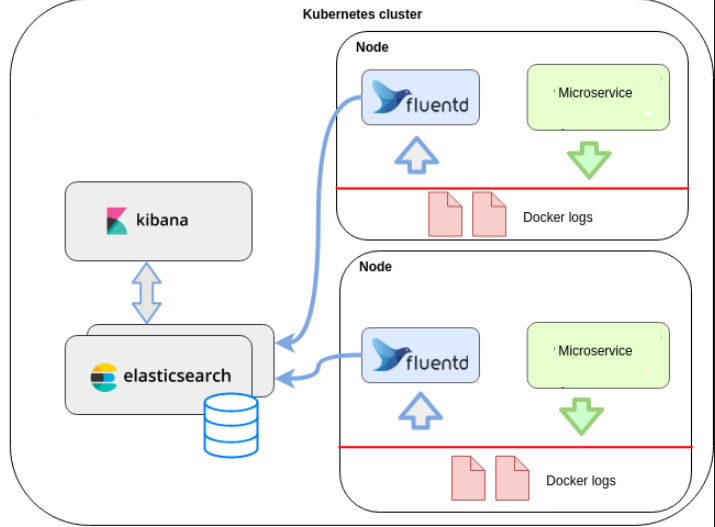
- Elasticsearch
一个开源的分布式、Restful 风格的搜索和数据分析引擎,它的底层是开源库Apache Lucene。它可以被下面这样准确地形容:
- 一个分布式的实时文档存储,每个字段可以被索引与搜索;
- 一个分布式实时分析搜索引擎;
-
能胜任上百个服务节点的扩展,并支持 PB 级别的结构化或者非结构化数据。
-
Kibana
Kibana是一个开源的分析和可视化平台,设计用于和Elasticsearch一起工作。可以通过Kibana来搜索,查看,并和存储在Elasticsearch索引中的数据进行交互。也可以轻松地执行高级数据分析,并且以各种图标、表格和地图的形式可视化数据。
一个针对日志的收集、处理、转发系统。通过丰富的插件系统,可以收集来自于各种系统或应用的日志,转化为用户指定的格式后,转发到用户所指定的日志存储系统之中。
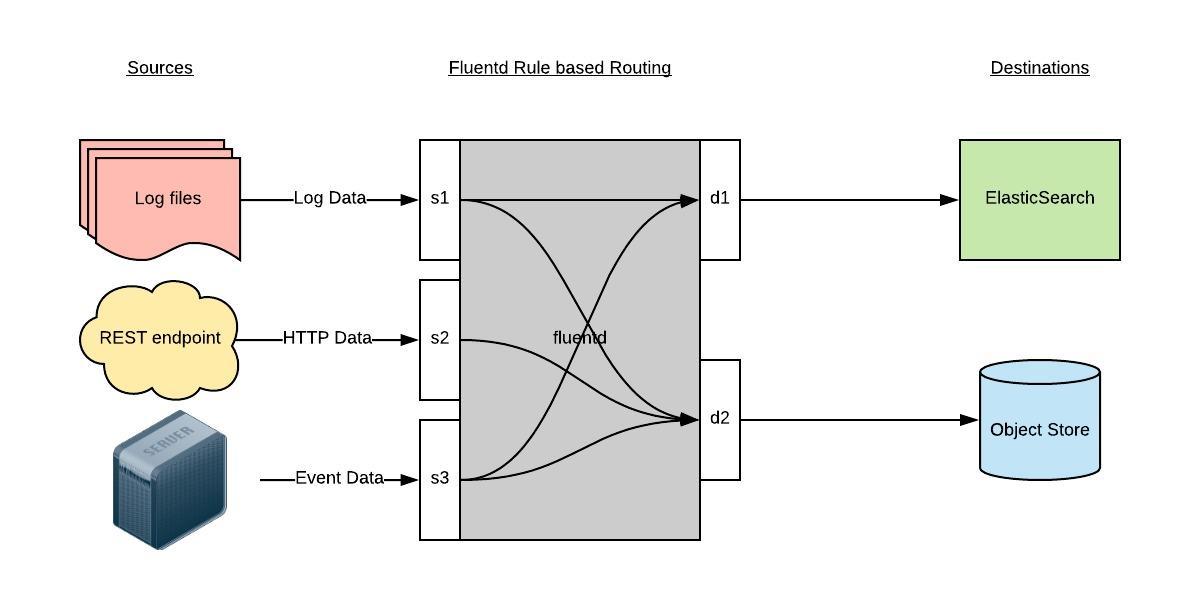
Fluentd 通过一组给定的数据源抓取日志数据,处理后(转换成结构化的数据格式)将它们转发给其他服务,比如 Elasticsearch、对象存储、kafka等等。Fluentd 支持超过300个日志存储和分析服务,所以在这方面是非常灵活的。主要运行步骤如下
- 首先 Fluentd 从多个日志源获取数据
- 结构化并且标记这些数据
- 然后根据匹配的标签将数据发送到多个目标服务
Fluentd精讲
Fluentd架构
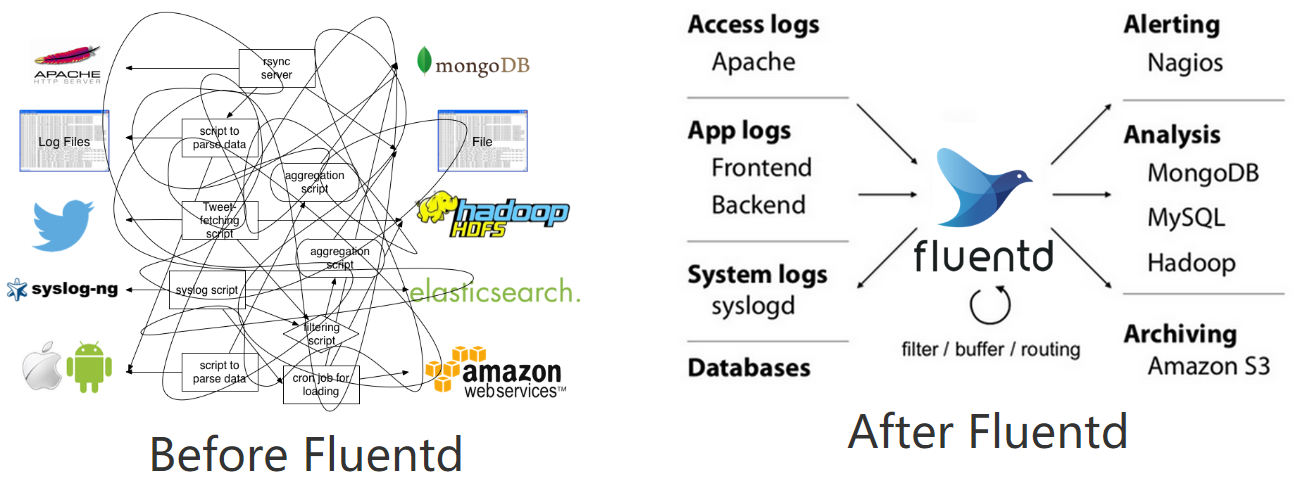
为什么推荐使用fluentd作为k8s体系的日志收集工具?
-
云原生:https://github.com/kubernetes/kubernetes/tree/release-1.21/cluster/addons/fluentd-elasticsearch
-
将日志文件JSON化
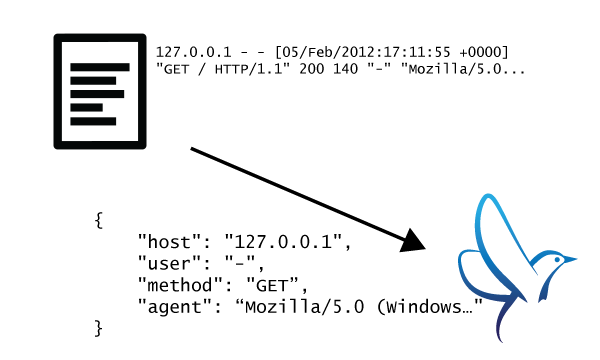
- 可插拔架构设计
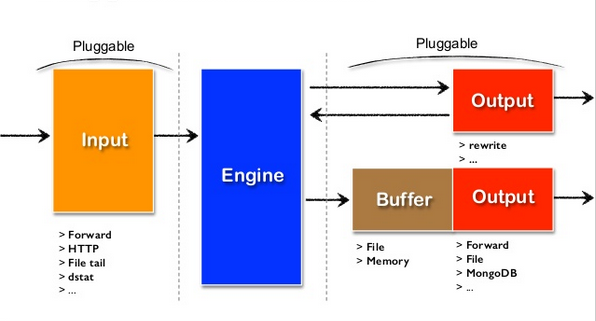
- 极小的资源占用
基于C和Ruby语言, 30-40MB,13,000 events/second/core

-
极强的可靠性
-
基于内存和本地文件的缓存
- 强大的故障转移
fluentd事件流的生命周期及指令配置
https://docs.fluentd.org/v/0.12/quickstart/life-of-a-fluentd-event
启动命令
指令介绍:
- source ,数据源,对应Input 通过使用 source 指令,来选择和配置所需的输入插件来启用 Fluentd 输入源, source 把事件提交到 fluentd 的路由引擎中。使用type来区分不同类型的数据源。如下配置可以监听指定文件的追加输入:
<source>
  @type tail
  path /var/log/httpd-access.log
  pos_file /var/log/td-agent/httpd-access.log.pos
  tag myapp.access
  format apache2
</source>
- filter,Event processing pipeline(事件处理流)
filter 可以串联成 pipeline,对数据进行串行处理,最终再交给 match 输出。 如下可以对事件内容进行处理:
<source>
  @type http
  port 9880
</source>

<filter myapp.access>
  @type record_transformer
  <record>
    host_param “#{Socket.gethostname}”
  </record>
</filter>
filter 获取数据后,调用内置的 @type record_transformer 插件,在事件的 record 里插入了新的字段 host_param,然后再交给 match 输出。
- label指令
可以在 source 里指定 @label,这个 source 所触发的事件就会被发送给指定的 label 所包含的任务,而不会被后续的其他任务获取到。
<source>
  @type forward
</source>

<source>
### 这个任务指定了 label 为 @SYSTEM
### 会被发送给 <label @SYSTEM>
### 而不会被发送给下面紧跟的 filter 和 match
  @type tail
  @label @SYSTEM
  path /var/log/httpd-access.log
  pos_file /var/log/td-agent/httpd-access.log.pos
  tag myapp.access
  format apache2
</source>

<filter access.**>
  @type record_transformer
  <record>
  # …
  </record>
</filter>

<match **>
  @type elasticsearch
  # …
</match>

<label @SYSTEM>
  ### 将会接收到上面 @type tail 的 source event
  <filter var.log.middleware.**>
    @type grep
    # …
  </filter>

  <match **>
    @type s3
    # …
  </match>
</label>
- match,匹配输出
查找匹配 “tags” 的事件,并处理它们。match 命令的最常见用法是将事件输出到其他系统(因此,与 match 命令对应的插件称为 “输出插件”)
<source>
  @type http
  port 9880
</source>

<filter myapp.access>
  @type record_transformer
  <record>
    host_param “#{Socket.gethostname}”
  </record>
</filter>

<match myapp.access>
  @type file
  path /var/log/fluent/access
</match>
事件的结构:
time:事件的处理时间
tag:事件的来源,在fluentd.conf中配置
record:真实的日志内容,json对象
比如,下面这条原始日志:
经过fluentd 引擎处理完后的样子可能是:
2020-07-16 08:40:35 +0000 apache.access: {"user":"-","method":"GET","code":200,"size":777,"host":"192.168.0.1","path":"/"}
fluentd的buffer事件缓冲模型
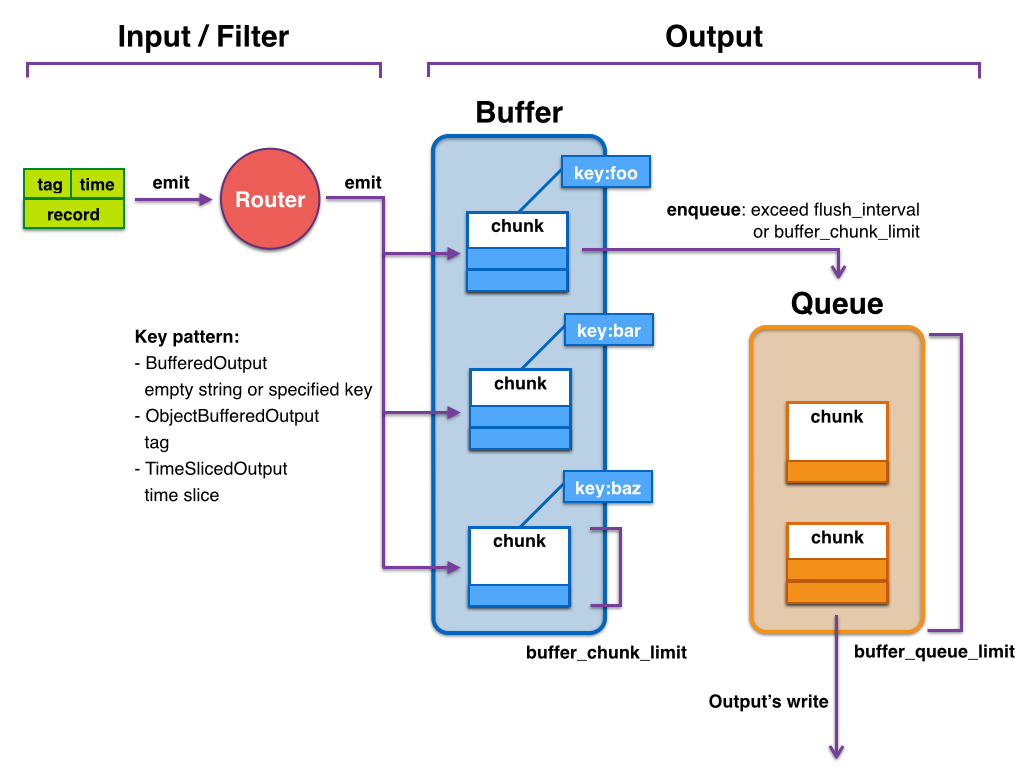
因为每个事件数据量通常很小,考虑数据传输效率、稳定性等方面的原因,所以基本不会每条事件处理完后都会立马写入到output端,因此fluentd建立了缓冲模型,模型中主要有两个概念:
- buffer_chunk:事件缓冲块,用来存储本地已经处理完待发送至目的端的事件,可以设置每个块的大小。
- buffer_queue:存储chunk的队列,可以设置长度
可以设置的参数,主要有:
- buffer_type,缓冲类型,可以设置file或者memory
- buffer_chunk_limit,每个chunk块的大小,默认8MB
- buffer_queue_limit ,chunk块队列的最大长度,默认256
- flush_interval ,flush一个chunk的时间间隔
- retry_limit ,chunk块发送失败重试次数,默认17次,之后就丢弃该chunk数据
- retry_wait ,重试发送chunk数据的时间间隔,默认1s,第2次失败再发送的话,间隔2s,下次4秒,以此类推
大致的过程为:
随着fluentd事件的不断生成并写入chunk,缓存块持变大,当缓存块满足buffer_chunk_limit大小或者新的缓存块诞生超过flush_interval时间间隔后,会推入缓存queue队列尾部,该队列大小由buffer_queue_limit决定。
比较理想的情况是每次有新的缓存块进入缓存队列,则立马会被写入到后端,同时,新缓存块也持续入列,但是入列的速度不会快于出列的速度,这样基本上缓存队列处于空的状态,队列中最多只有一个缓存块。
但是实际情况考虑网络等因素,往往缓存块被写入后端存储的时候会出现延迟或者写入失败的情况,当缓存块写入后端失败时,该缓存块还会留在队列中,等retry_wait时间后重试发送,当retry的次数达到retry_limit后,该缓存块被销毁(数据被丢弃)。
此时缓存队列持续有新的缓存块进来,如果队列中存在很多未及时写入到后端存储的缓存块的话,当队列长度达到buffer_queue_limit大小,则新的事件被拒绝,fluentd报错,error_class=Fluent::Plugin::Buffer::BufferOverflowError error="buffer space has too many data"。
还有一种情况是网络传输缓慢的情况,若每3秒钟会产生一个新块,但是写入到后端时间却达到了30s钟,队列长度为100,那么每个块出列的时间内,又有新的10个块进来,那么队列很快就会被占满,导致异常出现。
fluentd配置实战
实践一:监听业务应用日志,收集并输出
目标:收集容器内的nginx应用的access.log日志,并解析日志字段为JSON格式,原始日志的格式为:
$ tail -f access.log
...
53.49.146.149 1561620585.973 0.005 502 [27/Jun/2019:15:29:45 +0800] 178.73.215.171 33337 GET https
思路:
- 配置fluent.conf
- 使用@tail插件通过监听access.log文件
- 启动fluentd服务
- 手动追加内容至access.log文件
- 观察本地输出内容是否符合预期
fluent.conf
<source>
    @type tail
    path /var/log/nginx/access.log
    pos_file /var/log/nginx/nginx_access.posg
    tag nginx_access
    format none
    @log_level trace
</source>
<match  nginx_access>
    @type stdout
</match>
启动服务,追加文件内容:
# https://github.com/fluent/fluentd-kubernetes-daemonset
$ docker run -u root --rm -ti --entrypoint='' fluent/fluentd-kubernetes-daemonset:v1-debian-elasticsearch-amd64 bash

cat <<EOF >fluent.conf
<source>
    @type tail
    path /var/log/nginx/access.log
    pos_file /var/log/nginx/nginx_access.posg
    tag nginx_access
    format none
    @log_level trace
</source>
<match  nginx_access>
    @type stdout
</match>
EOF
/ # fluentd -c fluent.conf  # 终端监听/var/log/nginx/access.log 日志数据,有新数据会输出到标准输出

#另一个窗口操作 写入日志信息
[root@k8s-master ~]# docker ps
CONTAINER ID   IMAGE      COMMAND      CREATE      STATUS      PORTS              NAMES
65405228cb17   fluent/fluentd-kubernetes-daemonset:v1-debian-elasticsearch-amd64   "bash"
[root@k8s-master ~]# docker exec -ti 65405228cb17 sh
/ # echo '53.49.146.149 1561620585.973 0.005 502 [27/Jun/2019:15:29:45 +0800] 178.73.215.171 33337 GET https' >>/var/log/nginx/access.log


# 输出结果:
2022-11-19 03:31:42.956800427 +0000 nginx_access: {"message":"53.49.146.149 1561620585.973 0.005 502 [27/Jun/2019:15:29:45 +0800] 178.73.215.171 33337 GET https"}
实践二:实现业务应用日志的收集及字段解析
目标:收集容器内的nginx应用的access.log日志,并解析日志字段为JSON格式,原始日志的格式为:
$ tail -f access.log
...
53.49.146.149 1561620585.973 0.005 502 [27/Jun/2019:15:29:45 +0800] 178.73.215.171 33337 GET https
收集并处理成:
{
    "serverIp": "53.49.146.149",
    "timestamp": "1561620585.973",
    "respondTime": "0.005",
    "httpCode": "502",
    "eventTime": "27/Jun/2019:15:29:45 +0800",
    "clientIp": "178.73.215.171",
    "clientPort": "33337",
    "method": "GET",
    "protocol": "https"
}
fluent.conf
cat <<EOF >fluent.conf
<source>
    @type tail
    path /var/log/nginx/access.log
    pos_file /var/log/nginx/nginx_access.posg
    tag nginx_access
    format none
    @log_level trace
</source>
<filter  nginx_access>
    @type parser
    key_name message
    format  /(?<serverIp>[^ ]*) (?<timestamp>[^ ]*) (?<respondTime>[^ ]*) (?<httpCode>[^ ]*) \[(?<eventTime>[^\]]*)\] (?<clientIp>[^ ]*) (?<clientPort>[^ ]*) (?<method>[^ ]*) (?<protocol>[^ ]*)/
</filter>
<match  nginx_access>
  @type stdout
</match>
EOF

#修改配置后重新运行
root@65405228cb17:/home/fluent# fluentd -c fluent.conf

#另一个窗口,模拟产生日志
/ # echo '53.49.146.149 1561620585.973 0.005 502 [27/Jun/2019:15:29:45 +0800] 178.73.215.171 33337 GET https' >>/var/log/nginx/access.log
输出结果:
2022-11-19 03:34:43.005963334 +0000 nginx_access: {"serverIp":"53.49.146.149","timestamp":"1561620585.973","respondTime":"0.005","httpCode":"502","eventTime":"27/Jun/2019:15:29:45 +0800","clientIp":"178.73.215.171","clientPort":"33337","method":"GET","protocol":"https"}
使用该网站进行正则校验: http://fluentular.herokuapp.com
实践三:使用ruby实现日志字段的转换及自定义处理
cat <<\EOF > fluent.conf
<source>
    @type tail
    path /var/log/nginx/access.log
    pos_file /var/log/nginx/nginx_access.posg
    tag nginx_access
    format none
    @log_level trace
</source>
<filter  nginx_access>
    @type parser
    key_name message
    format  /(?<serverIp>[^ ]*) (?<timestamp>[^ ]*) (?<respondTime>[^ ]*) (?<httpCode>[^ ]*) \[(?<eventTime>[^\]]*)\] (?<clientIp>[^ ]*) (?<clientPort>[^ ]*) (?<method>[^ ]*) (?<protocol>[^ ]*)/
</filter>
<filter  nginx_access>
   @type record_transformer
   enable_ruby
   <record>
      host_name "#{Socket.gethostname}"
      my_key  "my_val"
      tls ${record["protocol"].index("https") ? "true" : "false"}
    </record>
</filter>
<match  nginx_access>
  @type stdout
</match>
EOF

#修改配置后重新运行
root@65405228cb17:/home/fluent# fluentd -c fluent.conf

#另一个窗口,模拟产生日志
/ # echo '53.49.146.149 1561620585.973 0.005 502 [27/Jun/2019:15:29:45 +0800] 178.73.215.171 33337 GET https' >>/var/log/nginx/access.log
输出结果:
2022-11-19 03:37:08.365890122 +0000 nginx_access: {"serverIp":"53.49.146.149","timestamp":"1561620585.973","respondTime":"0.005","httpCode":"502","eventTime":"27/Jun/2019:15:29:45 +0800","clientIp":"178.73.215.171","clientPort":"33337","method":"GET","protocol":"https","host_name":"23c22d63a1a7","my_key":"my_val","tls":"true"}
Input -> filter 1 -> ... -> filter N -> Buffer -> Output
configMap挂载场景
ConfigMap的配置文件挂载使用场景
开始之前,我们先来回顾一下,configmap的常用的挂载场景。
场景一:单文件挂载到空目录
假如业务应用有一个配置文件,名为 application.yml,如果想将此配置挂载到pod的/etc/application/目录中。
application.yml的内容为:
cat <<\EOF > application.yml
spring:
  application:
    name: svca-service
  cloud:
    config:
      uri: http://config:8888
      fail-fast: true
      username: user
      password: ${CONFIG_SERVER_PASSWORD:password}
      retry:
        initial-interval: 2000
        max-interval: 10000
        multiplier: 2
        max-attempts: 10
EOF
该配置文件在k8s中可以通过configmap来管理,通常我们有如下两种方式来管理配置文件:
- 通过kubectl命令行来生成configmap
# 通过文件直接创建
kubectl -n default create configmap application-config --from-file=application.yml

# 会生成配置文件,查看内容,configmap的key为文件名字
kubectl -n default get cm application-config -oyaml
- 通过yaml文件直接创建
cat <<\EOF > application-config.yaml
apiVersion: v1
kind: ConfigMap
metadata:
  name: application-config
  namespace: default
data:
  application.yml: |
    spring:
      application:
        name: svca-service
      cloud:
        config:
          uri: http://config:8888
          fail-fast: true
          username: user
          password: ${CONFIG_SERVER_PASSWORD:password}
          retry:
            initial-interval: 2000
            max-interval: 10000
            multiplier: 2
            max-attempts: 10
EOF

# 创建configmap
$ kubectl apply -f application-config.yaml
准备一个demo-deployment.yaml文件,挂载上述configmap到/etc/application/中
cat <<\EOF > demo-deployment.yaml
apiVersion: apps/v1
kind: Deployment
metadata:
  name: demo
  namespace: default
spec:
  selector:
    matchLabels:
      app: demo
  template:
    metadata:
      labels:
        app: demo
    spec:
      volumes:
      - configMap:
          name: application-config
        name: config
      containers:
      - name: nginx
        image: nginx:alpine
        imagePullPolicy: IfNotPresent
        volumeMounts:
        - mountPath: "/etc/application"
          name: config
EOF
创建并查看:
$ kubectl apply -f demo-deployment.yaml

kubectl get po
kubectl exec demo-67c7c99d47-vvltn -- cat /etc/application/application.yml
修改configmap文件的内容,观察pod中是否自动感知变化:
$ kubectl edit cm application-config

[root@k8s-master helm3]# kubectl edit cm application-config  #修改了端口 8889
Edit cancelled, no changes made.
[root@k8s-master helm3]# kubectl exec demo-67c7c99d47-vvltn -- cat /etc/application/application.yml # 30秒之后查看也改变了
整个configmap文件直接挂载到pod中,若configmap变化,pod会自动感知并拉取到pod内部。
但是pod内的进程不会自动重启,所以很多服务会实现一个内部的reload接口,用来加载最新的配置文件到进程中。
场景二:多文件挂载
假如有多个配置文件,都需要挂载到pod内部,且都在一个目录中
cat <<\EOF > application.yml
spring:
  application:
    name: svca-service
  cloud:
    config:
      uri: http://config:8888
      fail-fast: true
      username: user
      password: ${CONFIG_SERVER_PASSWORD:password}
      retry:
        initial-interval: 2000
        max-interval: 10000
        multiplier: 2
        max-attempts: 10
EOF

cat <<\EOF > supervisord.conf
[unix_http_server]
file=/var/run/supervisor.sock
chmod=0700

[supervisord]
logfile=/var/logs/supervisor/supervisord.log
logfile_maxbytes=200MB
logfile_backups=10
loglevel=info
pidfile=/var/run/supervisord.pid
childlogdir=/var/cluster_conf_agent/logs/supervisor
nodaemon=false
EOF
同样可以使用两种方式创建:
 kubectl delete cm application-config

 kubectl create cm application-config --from-file=application.yml --from-file=supervisord.conf

 kubectl get cm application-config -oyaml
观察Pod已经自动获取到最新的变化
此时,是挂载到pod内的空目录中/etc/application,假如想挂载到pod已存在的目录中,比如:
更改deployment的挂载目录:
cat <<\EOF > demo-deployment.yaml
apiVersion: apps/v1
kind: Deployment
metadata:
  name: demo
  namespace: default
spec:
  selector:
    matchLabels:
      app: demo
  template:
    metadata:
      labels:
        app: demo
    spec:
      volumes:
      - configMap:
          name: application-config
        name: config
      containers:
      - name: nginx
        image: nginx:alpine
        imagePullPolicy: IfNotPresent
        volumeMounts:
        - mountPath: "/etc/profile.d"
          name: config
EOF
重建pod
$ kubectl apply -f demo-deployment.yaml

# 查看pod内的/etc/profile.d目录,发现已有文件被覆盖
$ kubectl exec demo-77d685b9f7-68qz7 -- ls /etc/profile.d
application.yml
supervisord.conf
场景三 挂载子路径
实现多个配置文件,可以挂载到pod内的不同的目录中。比如:
application.yml挂载到/etc/application/supervisord.conf挂载到/etc/profile.d
configmap保持不变,修改deployment文件:
cat <<\EOF > demo-deployment.yaml
apiVersion: apps/v1
kind: Deployment
metadata:
  name: demo
  namespace: default
spec:
  selector:
    matchLabels:
      app: demo
  template:
    metadata:
      labels:
        app: demo
    spec:
      volumes:
      - name: config
        configMap:
          name: application-config
          items:
          - key: application.yml
            path: application
          - key: supervisord.conf
            path: supervisord
      containers:
      - name: nginx
        image: nginx:alpine
        imagePullPolicy: IfNotPresent
        volumeMounts:
        - mountPath: "/etc/application/application.yml"
          name: config
          subPath: application
        - mountPath: "/etc/profile.d/supervisord.conf"
          name: config
          subPath: supervisord
EOF
测试挂载:
kubectl apply -f demo-deployment.yaml

# kubectl exec demo-78489c754-shjhz -- ls /etc/application
application.yml

# kubectl exec demo-78489c754-shjhz -- ls /etc/profile.d/
supervisord.conf
color_prompt
locale
使用subPath挂载到Pod内部的文件,不会自动感知原有ConfigMap的变更
EFK基于k8s部署
部署es服务
部署分析
- es生产环境是部署es集群,通常会使用statefulset进行部署
- es默认使用elasticsearch用户启动进程,es的数据目录是通过宿主机的路径挂载,因此目录权限被主机的目录权限覆盖,因此可以利用initContainer容器在es进程启动之前把目录的权限修改掉,注意init container要用特权模式启动。
- 若希望使用helm部署,参考 https://github.com/helm/charts/tree/master/stable/elasticsearch
使用StatefulSet管理有状态服务
使用Deployment创建多副本的pod的情况:
cat <<\EOF > deploy-nginx.yaml
apiVersion: apps/v1
kind: Deployment
metadata:
  name: nginx-deployment
  namespace: default
  labels:
    app: nginx-deployment
spec:
  replicas: 3
  selector:
    matchLabels:
      app: nginx-deployment
  template:
    metadata:
      labels:
        app: nginx-deployment
    spec:
      containers:
      - name: nginx
        image: nginx:alpine
        ports:
        - containerPort: 80
EOF
使用StatefulSet创建多副本pod的情况:
cat <<\EOF > statefulset-nginx.yaml
apiVersion: apps/v1
kind: StatefulSet
metadata:
  name: nginx-statefulset
  namespace: default
  labels:
    app: nginx-sts
spec:
  replicas: 3
  serviceName: "nginx"
  selector:
    matchLabels:
      app: nginx-sts
  template:
    metadata:
      labels:
        app: nginx-sts
    spec:
      containers:
      - name: nginx
        image: nginx:alpine
        ports:
        - containerPort: 80
EOF
无头服务Headless Service
cat <<\EOF > service-nginx.yaml
kind: Service
apiVersion: v1
metadata:
  name: nginx
  namespace: default
spec:
  selector:
    app: nginx-sts
  ports:
  - protocol: TCP
    port: 80
    targetPort: 80
  clusterIP: None
EOF

kubectl create -f deploy-nginx.yaml
kubectl create -f statefulset-nginx.yaml
kubectl create -f service-nginx.yaml

[root@k8s-master ~]# kubectl get po -owide
NAME                                READY   STATUS    RESTARTS   AGE   IP            NODE
nginx-deployment-5bbbc49956-2p7sj   1/1     Running   0          31s   10.244.2.53   k8s-slave2
nginx-deployment-5bbbc49956-6ktgw   1/1     Running   0          31s   10.244.1.59   k8s-slave1
nginx-deployment-5bbbc49956-fv67r   1/1     Running   0          31s   10.244.0.17   k8s-master
nginx-statefulset-0                 1/1     Running   0          30s   10.244.1.60   k8s-slave1
nginx-statefulset-1                 1/1     Running   0          28s   10.244.2.54   k8s-slave2
nginx-statefulset-2                 1/1     Running   0          26s   10.244.0.18   k8s-master

[root@k8s-master ~]# kubectl get svc
NAME         TYPE        CLUSTER-IP   EXTERNAL-IP   PORT(S)   AGE
kubernetes   ClusterIP   10.96.0.1    <none>        443/TCP   6d4h
nginx        ClusterIP   None         <none>        80/TCP    2m56s

$ kubectl -n default exec -ti nginx-statefulset-0 -- sh
/ # curl nginx-statefulset-2.nginx     #statefulset副本之间 通过pod名称.service的name 可以互相通信
部署并验证
es-config.yaml
cat <<\EOF > es-config.yaml
apiVersion: v1
kind: ConfigMap
metadata:
  name: es-config
  namespace: logging
data:
  elasticsearch.yml: |
    cluster.name: "luffy-elasticsearch"
    node.name: "${POD_NAME}"
    network.host: 0.0.0.0
    discovery.seed_hosts: "es-svc-headless"
    cluster.initial_master_nodes: "elasticsearch-0,elasticsearch-1,elasticsearch-2"
EOF
es-svc-headless.yaml
cat <<\EOF > es-svc-headless.yaml
apiVersion: v1
kind: Service
metadata:
  name: es-svc-headless
  namespace: logging
  labels:
    k8s-app: elasticsearch
spec:
  selector:
    k8s-app: elasticsearch
  clusterIP: None
  ports:
  - name: in
    port: 9300
    protocol: TCP
EOF
es-statefulset.yaml
cat <<\EOF > es-statefulset.yaml
apiVersion: apps/v1
kind: StatefulSet
metadata:
  name: elasticsearch
  namespace: logging
  labels:
    k8s-app: elasticsearch
spec:
  replicas: 3
  serviceName: es-svc-headless
  selector:
    matchLabels:
      k8s-app: elasticsearch
  template:
    metadata:
      labels:
        k8s-app: elasticsearch
    spec:
      initContainers:
      - command:
        - /sbin/sysctl
        - -w
        - vm.max_map_count=262144
        image: alpine:3.6
        imagePullPolicy: IfNotPresent
        name: elasticsearch-logging-init
        resources: {}
        securityContext:
          privileged: true
      - name: fix-permissions
        image: alpine:3.6
        command: ["sh", "-c", "chown -R 1000:1000 /usr/share/elasticsearch/data"]
        securityContext:
          privileged: true
        volumeMounts:
        - name: es-data-volume
          mountPath: /usr/share/elasticsearch/data
      containers:
      - name: elasticsearch
        image: elasticsearch:7.4.2
        env:
          - name: POD_NAME
            valueFrom:
              fieldRef:
                fieldPath: metadata.name
        resources:
          limits:
            cpu: '1'
            memory: 2Gi
          requests:
            cpu: '1'
            memory: 2Gi
        ports:
        - containerPort: 9200
          name: db
          protocol: TCP
        - containerPort: 9300
          name: transport
          protocol: TCP
        volumeMounts:
          - name: es-config-volume
            mountPath: /usr/share/elasticsearch/config/elasticsearch.yml
            subPath: elasticsearch.yml
          - name: es-data-volume
            mountPath: /usr/share/elasticsearch/data
      volumes:
        - name: es-config-volume
          configMap:
            name: es-config
            items:
            - key: elasticsearch.yml
              path: elasticsearch.yml
  volumeClaimTemplates:
  - metadata:
      name: es-data-volume
    spec:
      accessModes: ["ReadWriteOnce"]
      storageClassName: "nfs"
      resources:
        requests:
          storage: 5Gi
EOF
es-svc.yaml
cat <<\EOF > es-svc.yaml
apiVersion: v1
kind: Service
metadata:
  name: es-svc
  namespace: logging
  labels:
    k8s-app: elasticsearch
spec:
  selector:
    k8s-app: elasticsearch
  ports:
  - name: out
    port: 9200
    protocol: TCP
EOF
$ kubectl create namespace logging

## 部署服务
kubectl apply -f es-config.yaml
kubectl apply -f es-svc-headless.yaml
kubectl apply -f es-statefulset.yaml
kubectl apply -f es-svc.yaml

## 等待片刻,查看一下es的pod,状态变为running
$ kubectl -n logging get po -o wide
NAME              READY   STATUS    RESTARTS   AGE   IP
elasticsearch-0   1/1     Running   0          15m   10.244.0.126
elasticsearch-1   1/1     Running   0          15m   10.244.0.127
elasticsearch-2   1/1     Running   0          15m   10.244.0.128
# 然后通过curl命令访问一下服务,验证es是否部署成功
$ kubectl -n logging get svc
es-svc            ClusterIP   10.104.226.175   <none>        9200/TCP   2s
es-svc-headless   ClusterIP   None             <none>        9300/TCP   32m
$ curl 10.104.226.175:9200
{
  "name" : "elasticsearch-2",
  "cluster_name" : "luffy-elasticsearch",
  "cluster_uuid" : "7FDIACx9T-2ajYcB5qp4hQ",
  "version" : {
    "number" : "7.4.2",
    "build_flavor" : "default",
    "build_type" : "docker",
    "build_hash" : "2f90bbf7b93631e52bafb59b3b049cb44ec25e96",
    "build_date" : "2019-10-28T20:40:44.881551Z",
    "build_snapshot" : false,
    "lucene_version" : "8.2.0",
    "minimum_wire_compatibility_version" : "6.8.0",
    "minimum_index_compatibility_version" : "6.0.0-beta1"
  },
  "tagline" : "You Know, for Search"
部署kibana
部署分析
- kibana需要暴露web页面给前端使用,因此使用ingress配置域名来实现对kibana的访问
- kibana为无状态应用,直接使用Deployment来启动
- kibana需要访问es,直接利用k8s服务发现访问此地址即可,http://es-svc:9200
部署并验证
kibana.yaml
cat <<\EOF > kibana-all.yaml
apiVersion: apps/v1
kind: Deployment
metadata:
  name: kibana
  namespace: logging
  labels:
    app: kibana
spec:
  selector:
    matchLabels:
      app: "kibana"
  template:
    metadata:
      labels:
        app: kibana
    spec:
      containers:
      - name: kibana
        image: kibana:7.4.2
        resources:
          limits:
            cpu: 1000m
          requests:
            cpu: 100m
        env:
          - name: ELASTICSEARCH_HOSTS
            value: http://es-svc:9200
          - name: SERVER_NAME
            value: kibana-logging
          - name: SERVER_REWRITEBASEPATH
            value: "false"
        ports:
        - containerPort: 5601
        volumeMounts:
          - name: config
            mountPath: /usr/share/kibana/config/
      volumes:
        - name: config
          configMap:
            name: kibana-config
---
apiVersion: v1
kind: ConfigMap
metadata:
  name: kibana-config
  namespace: logging
data:
  kibana.yml: |-
    elasticsearch.requestTimeout: 90000
    server.host: "0"
    xpack.monitoring.ui.container.elasticsearch.enabled: true
---
apiVersion: v1
kind: Service
metadata:
  name: kibana
  namespace: logging
  labels:
    app: kibana
spec:
  ports:
  - port: 5601
    protocol: TCP
    targetPort: 5601
  type: ClusterIP
  selector:
    app: kibana
---
apiVersion: networking.k8s.io/v1
kind: Ingress
metadata:
  name: kibana
  namespace: logging
spec:
  ingressClassName: nginx
  rules:
  - host: kibana.luffy.com
    http:
      paths:
      - path: /
        pathType: Prefix
        backend:
          service:
            name: kibana
            port:
              number: 5601
EOF
$ kubectl apply -f kibana-all.yaml
deployment.apps/kibana created
service/kibana created
ingress/kibana created

[root@k8s-master ~]# kubectl -n logging get ingress
NAME     CLASS   HOSTS              ADDRESS   PORTS   AGE
kibana   nginx   kibana.luffy.com             80      40s
[root@k8s-master ~]# kubectl -n logging get svc
NAME              TYPE        CLUSTER-IP       EXTERNAL-IP   PORT(S)    AGE
es-svc            ClusterIP   10.109.208.147   <none>        9200/TCP   10h
es-svc-headless   ClusterIP   None             <none>        9300/TCP   10h
kibana            ClusterIP   10.108.109.8     <none>        5601/TCP   47s
[root@k8s-master ~]# kubectl -n logging get po
NAME                      READY   STATUS    RESTARTS        AGE
elasticsearch-0           1/1     Running   1 (6m21s ago)   10m
elasticsearch-1           1/1     Running   1 (6m22s ago)   10m
elasticsearch-2           1/1     Running   0               10m
kibana-7df699c857-v2rvk   1/1     Running   0               78s

## 配置域名解析
# hosts
10.0.0.226 kibana.luffy.com
# kibana.luffy.com,并访问服务进行验证,若可以访问,说明连接es成功
# GET /_cat/health?v
# GET /_cat/indices
Fluentd服务部署
部署分析
- fluentd为日志采集服务,kubernetes集群的每个业务节点都有日志产生,因此需要使用daemonset的模式进行部署
- 为进一步控制资源,会为daemonset指定一个选择标签,fluentd=true来做进一步过滤,只有带有此标签的节点才会部署fluentd
部署服务
注意点:
Docker的日志输出格式与Containerd的日志格式不同,因此需要注意解析日志时要使用新的格式解析器:
https://github.com/fluent/fluentd-kubernetes-daemonset#use-cri-parser-for-containerdcri-o-logs
fluentd-config-tail-container-parse.yaml
cat <<\EOF > tail_container_parse.conf
# configuration example
<parse>
  @type cri
</parse>
EOF
# 创建configmap,后面挂载给fluentd使用,适配containerd的日志格式
kubectl -n logging create configmap tail-container-parse --from-file=tail_container_parse.conf
fluentd-rbac.yaml
cat <<\EOF > fluentd-rbac.yaml
apiVersion: v1
kind: ServiceAccount
metadata:
  name: fluentd-es
  namespace: logging
  labels:
    k8s-app: fluentd-es
    kubernetes.io/cluster-service: "true"
    addonmanager.kubernetes.io/mode: Reconcile
---
kind: ClusterRole
apiVersion: rbac.authorization.k8s.io/v1
metadata:
  name: fluentd-es
  labels:
    k8s-app: fluentd-es
    kubernetes.io/cluster-service: "true"
    addonmanager.kubernetes.io/mode: Reconcile
rules:
- apiGroups:
  - ""
  resources:
  - "namespaces"
  - "pods"
  verbs:
  - "get"
  - "watch"
  - "list"
---
kind: ClusterRoleBinding
apiVersion: rbac.authorization.k8s.io/v1
metadata:
  name: fluentd-es
  labels:
    k8s-app: fluentd-es
    kubernetes.io/cluster-service: "true"
    addonmanager.kubernetes.io/mode: Reconcile
subjects:
- kind: ServiceAccount
  name: fluentd-es
  namespace: logging
  apiGroup: ""
roleRef:
  kind: ClusterRole
  name: fluentd-es
  apiGroup: ""
EOF
daemonset定义文件,注意点:
- 需要将/var/log/pods/目录挂载到容器中
- 需要将fluentd的configmap中的配置文件挂载到容器内
- 想要部署fluentd的节点,需要添加fluentd=true的标签
fluentd-daemonset.yaml
cat <<\EOF > fluentd-daemonset.yaml
apiVersion: apps/v1
kind: DaemonSet
metadata:
  name: fluentd
  namespace: logging
  labels:
    k8s-app: fluentd-logging
    version: v1
spec:
  selector:
    matchLabels:
      k8s-app: fluentd-logging
      version: v1
  template:
    metadata:
      labels:
        k8s-app: fluentd-logging
        version: v1
    spec:
      nodeSelector:
        fluentd: "true"
      serviceAccount: fluentd-es
      serviceAccountName: fluentd-es
      containers:
      - name: fluentd
        image: fluent/fluentd-kubernetes-daemonset:v1-debian-elasticsearch-amd64
        env:
          - name: K8S_NODE_NAME
            valueFrom:
              fieldRef:
                fieldPath: spec.nodeName
          - name:  FLUENT_ELASTICSEARCH_HOST
            value: "es-svc"
          - name:  FLUENT_ELASTICSEARCH_PORT
            value: "9200"
          - name: FLUENT_ELASTICSEARCH_SCHEME
            value: "http"
          - name: FLUENTD_SYSTEMD_CONF
            value: "disable"
          - name: FLUENTD_PROMETHEUS_CONF
            value: "disable"
        resources:
          limits:
            memory: 200Mi
          requests:
            cpu: 100m
            memory: 200Mi
        volumeMounts:
        - name: varlog
          mountPath: /var/log
        # When actual pod logs in /var/lib/docker/containers, the following lines should be used.
        # - name: dockercontainerlogdirectory
        #   mountPath: /var/lib/docker/containers
        #   readOnly: true
        # When actual pod logs in /var/log/pods, the following lines should be used.
        - name: dockercontainerlogdirectory
          mountPath: /var/log/pods
          readOnly: true
        - mountPath: "/fluentd/etc/tail_container_parse.conf"
          name: config
          subPath: tail-container-parse
      terminationGracePeriodSeconds: 30
      volumes:
      - name: varlog
        hostPath:
          path: /var/log
      # When actual pod logs in /var/lib/docker/containers, the following lines should be used.
      # - name: dockercontainerlogdirectory
      #   hostPath:
      #     path: /var/lib/docker/containers
      # When actual pod logs in /var/log/pods, the following lines should be used.
      - name: dockercontainerlogdirectory
        hostPath:
          path: /var/log/pods
      - name: config
        configMap:
          name: tail-container-parse
          items:
          - key: tail_container_parse.conf
            path: tail-container-parse
EOF
## 给slave1打上标签,进行部署fluentd日志采集服务
kubectl label node k8s-slave1 fluentd=true
kubectl label node k8s-slave2 fluentd=true

# 创建服务
kubectl apply -f fluentd-rbac.yaml
kubectl apply -f fluentd-daemonset.yaml

## 然后查看一下pod是否正常运行
kubectl -n logging get po -o wide
日志收集功能验证
EFK功能验证
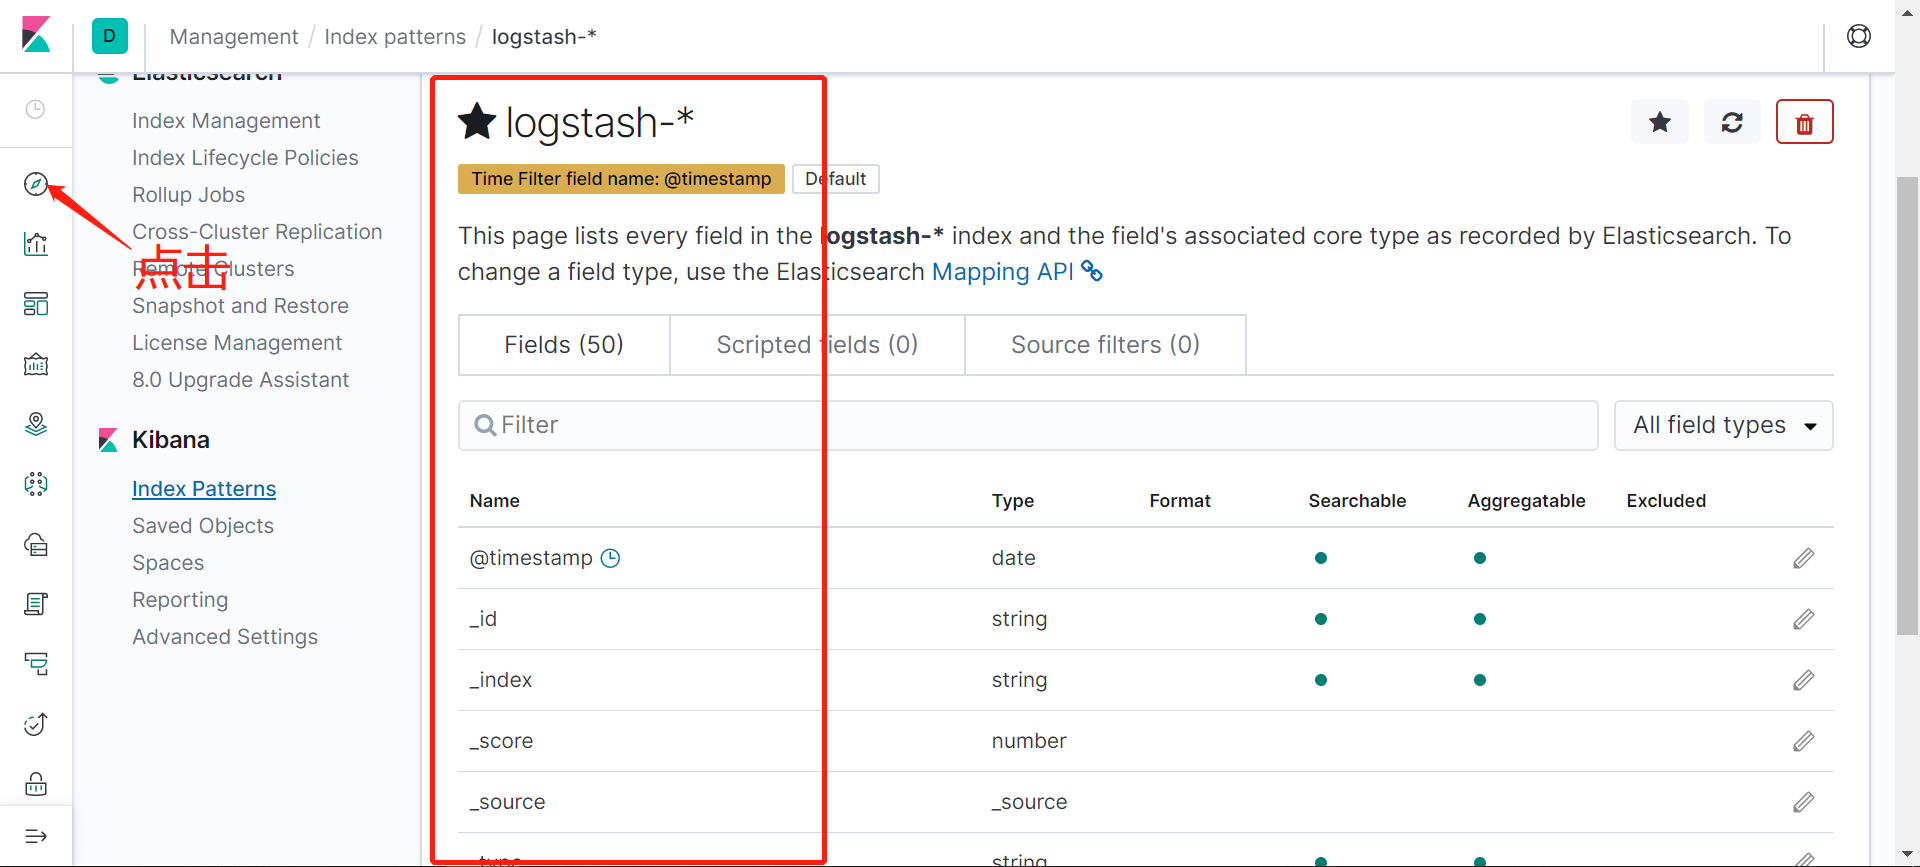
配置kibana
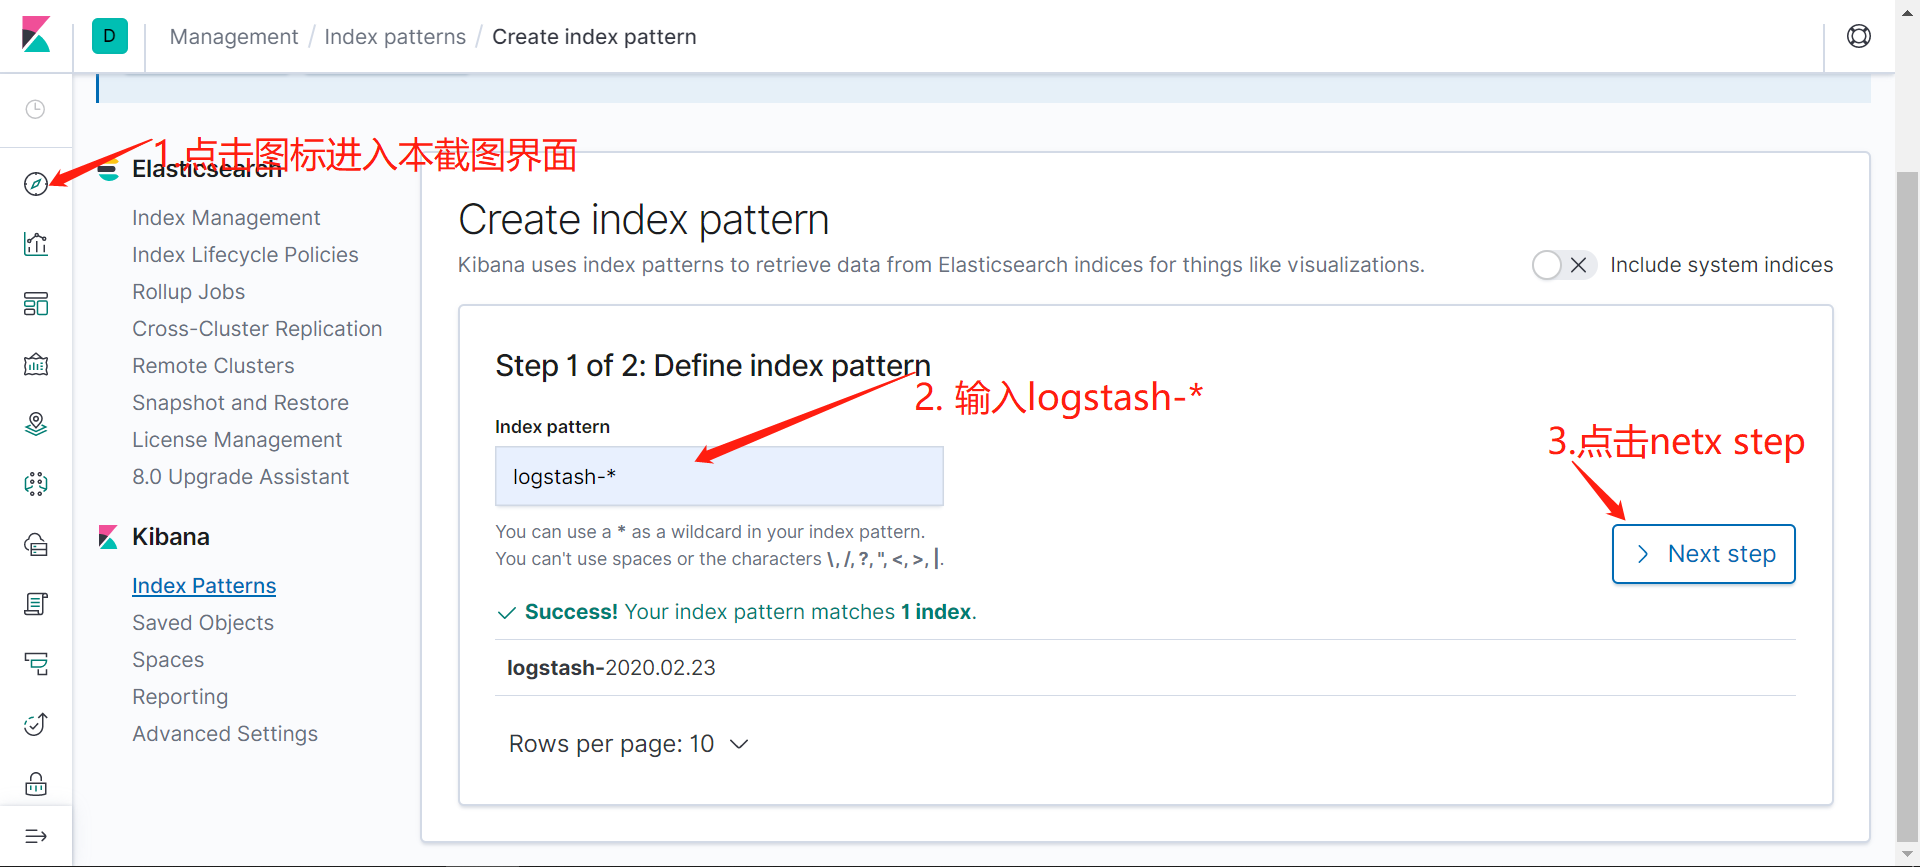
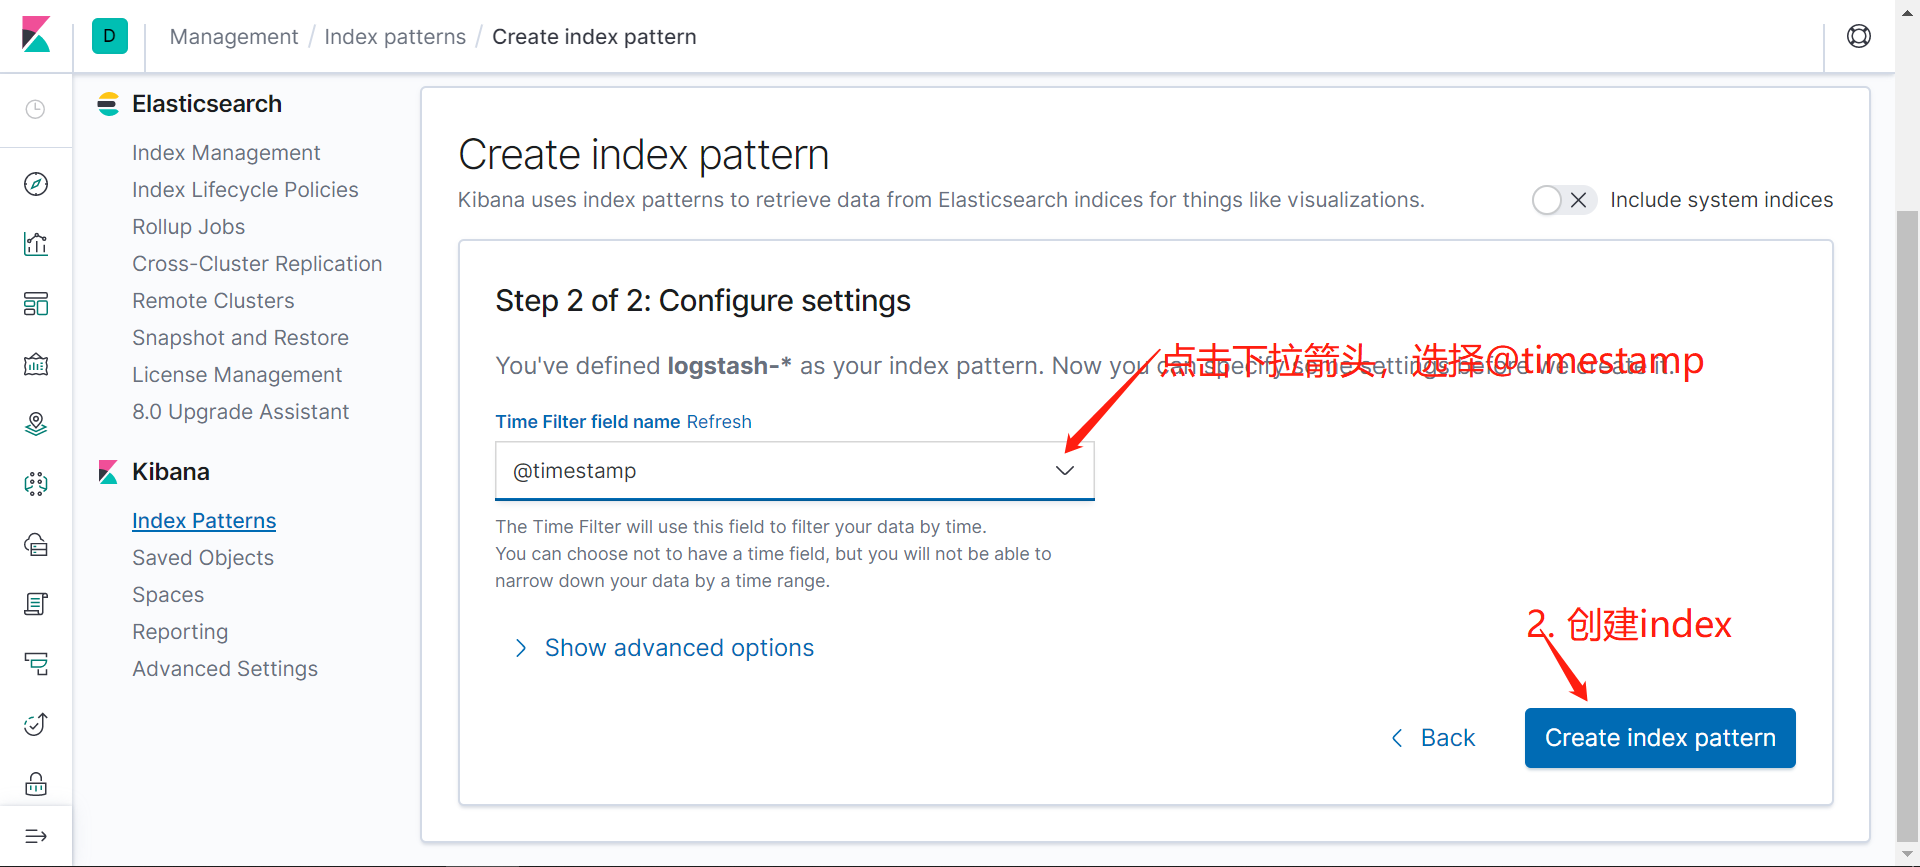
登录kibana界面,按照截图的顺序操作:
logstash-*
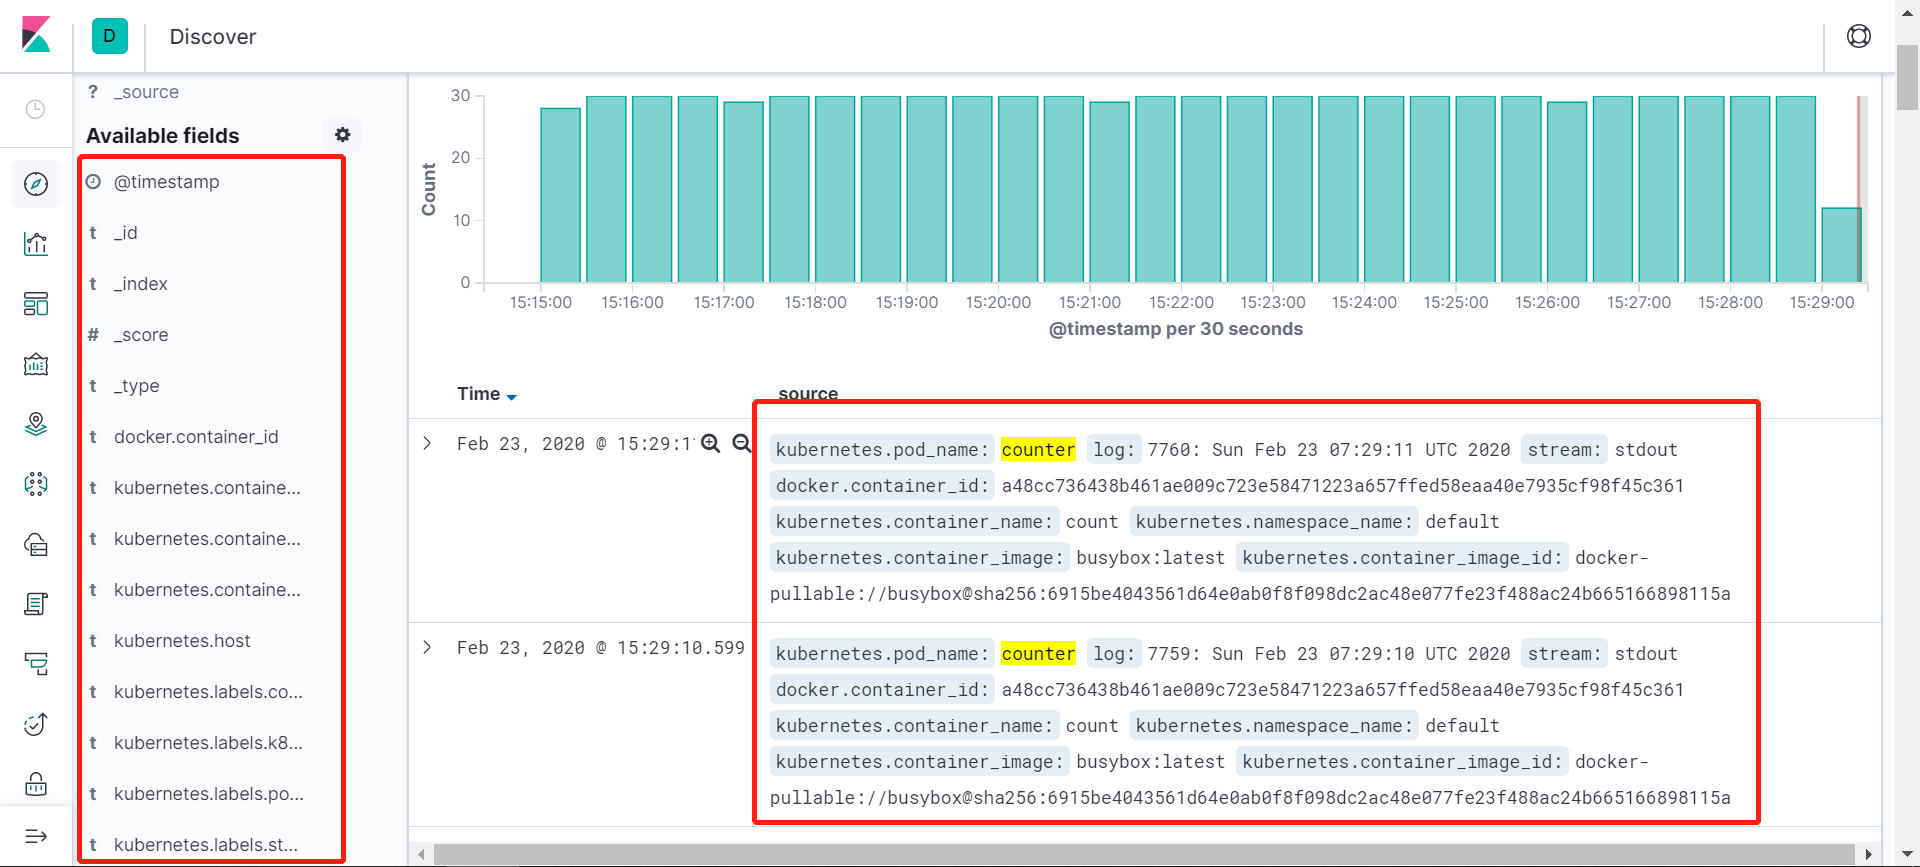
思考:日志中出现了很多kubernetes的元数据信息,这些数据从哪采集而来
https://github.com/fabric8io/fluent-plugin-kubernetes_metadata_filter
到这里,我们就在 Kubernetes 集群上成功部署了 EFK ,要了解如何使用 Kibana 进行日志数据分析,可以参考 Kibana 用户指南文档:https://www.elastic.co/guide/en/kibana/current/index.html
测试资源有限, 释放资源
dlete -f demo-deployment.yaml
kubectl delete cm application-config

kubectl delete -f es-config.yaml
kubectl delete -f es-svc-headless.yaml
kubectl delete -f es-statefulset.yaml
kubectl delete -f es-svc.yaml
kubectl delete -f kibana-all.yaml

kubectl delete -f fluentd-rbac.yaml
kubectl delete -f fluentd-daemonset.yaml